Weekly Profile (Side Panel)
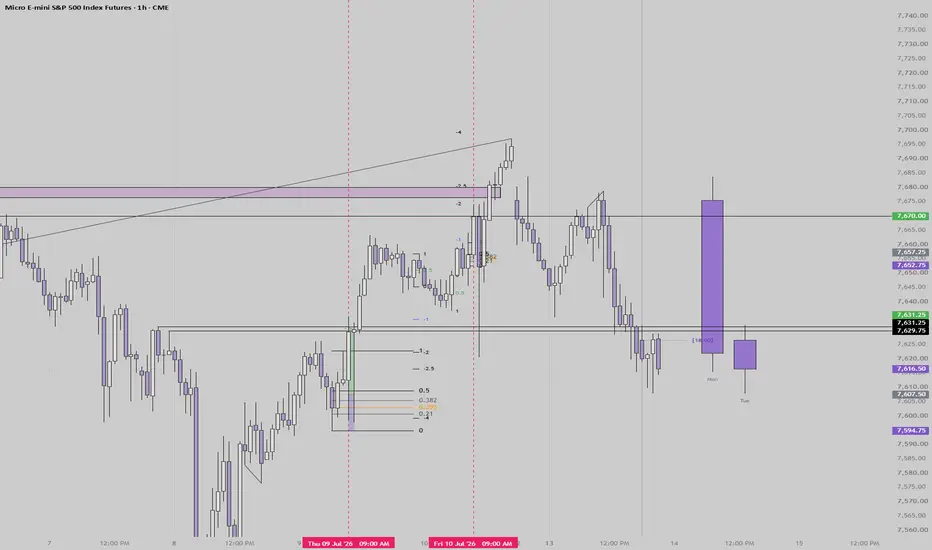
Weekly Profile (Side Panel)
Builds a live, day-by-day "weekly profile" of daily candles and displays them as a compact panel off to the side of live price, on any chart timeframe of 4H or lower.
How it works:
- Each trading day is defined using the standard futures/forex session convention: 18:00 ET to 18:00 ET the next day. Sunday 18:00 ET marks the start of the "Monday" session.
- As the week progresses, the indicator accumulates a running Open/High/Low/Close for each weekday from the lower-timeframe bars on your chart, effectively reconstructing what the daily candle would look like.
- On Monday, only the Monday candle is shown, updating live. On Tuesday, Monday (finalized) and Tuesday (live) are both shown. This continues through Friday.
- When the Friday session closes and the next Monday session opens, the whole panel resets and rebuilds for the new week.
Display:
- The 5 daily candles are drawn as boxes (bodies) with wick lines, positioned in a fixed panel to the right of the live price action rather than overlaid on the real bars.
- Body fill color reflects up/down, with a separate customizable border color/width so the bodies are clearly outlined.
- Optional Mon/Tue/Wed/Thu/Fri labels under each candle.
- Gap from live price, candle width, and spacing between candles are all adjustable inputs.
Notes:
- Only runs on timeframes of 4H or lower; on higher timeframes it shows a warning label instead.
- Designed for instruments with real session gaps (futures, forex); on 24/7 feeds the reset still triggers off the NY 18:00 boundary but there's no actual market closure to align it with.
Builds a live, day-by-day "weekly profile" of daily candles and displays them as a compact panel off to the side of live price, on any chart timeframe of 4H or lower.
How it works:
- Each trading day is defined using the standard futures/forex session convention: 18:00 ET to 18:00 ET the next day. Sunday 18:00 ET marks the start of the "Monday" session.
- As the week progresses, the indicator accumulates a running Open/High/Low/Close for each weekday from the lower-timeframe bars on your chart, effectively reconstructing what the daily candle would look like.
- On Monday, only the Monday candle is shown, updating live. On Tuesday, Monday (finalized) and Tuesday (live) are both shown. This continues through Friday.
- When the Friday session closes and the next Monday session opens, the whole panel resets and rebuilds for the new week.
Display:
- The 5 daily candles are drawn as boxes (bodies) with wick lines, positioned in a fixed panel to the right of the live price action rather than overlaid on the real bars.
- Body fill color reflects up/down, with a separate customizable border color/width so the bodies are clearly outlined.
- Optional Mon/Tue/Wed/Thu/Fri labels under each candle.
- Gap from live price, candle width, and spacing between candles are all adjustable inputs.
Notes:
- Only runs on timeframes of 4H or lower; on higher timeframes it shows a warning label instead.
- Designed for instruments with real session gaps (futures, forex); on 24/7 feeds the reset still triggers off the NY 18:00 boundary but there's no actual market closure to align it with.

Thông báo miễn trừ trách nhiệm
Thông tin và các ấn phẩm này không nhằm mục đích, và không cấu thành, lời khuyên hoặc khuyến nghị về tài chính, đầu tư, giao dịch hay các loại khác do TradingView cung cấp hoặc xác nhận. Đọc thêm tại Điều khoản Sử dụng.
Thông báo miễn trừ trách nhiệm
Thông tin và các ấn phẩm này không nhằm mục đích, và không cấu thành, lời khuyên hoặc khuyến nghị về tài chính, đầu tư, giao dịch hay các loại khác do TradingView cung cấp hoặc xác nhận. Đọc thêm tại Điều khoản Sử dụng.