OPEN-SOURCE SCRIPT
Multi-Timeframe Support & Resistance Indicator
Description:
Trading Price Action is a strategy that depends basically in levels where the price movement is rejected and those levels are called Support and Resistance.
- Support level happens when the price level move below the current price and find a level to prevent a further downward move due buyers step in pushing the price back upward.
- Resistance level happens when the price move above the current price and find a level that prevents the price move further up due sellers step in pushing the price back downward.
Based on the main market trend those levels can be used to identify possible entries (preferably in the same direction of the main trend) or they can be used for Stoploss and Take profit levels.
So based on those concepts and my decision to trade only Price Action I decided to develop this indicator. On it I can see the main trend for the higher time frames like Monthly, Weekly and Daily.
That information is important to help me understand how the market is behaving on those timeframes widely used by trading companies and improve my chances to be on the right side of the trend.
When I am analyzing the charts I look for the below points:
• what is the the main trends?
• then I drop for my entry timeframe;
• check for a rejection from Support or Resistance(based on the main trend direction);
• set my entry: pending Limit or Stop or market
• set your Stoploss and Take profit levels
• and, more important, wait for a new bar open.
To identify the Stoploss I use the ATR. The Average True Range measure market volatility meaning how much the market moved in a period of time and it is widely used for professional traders.
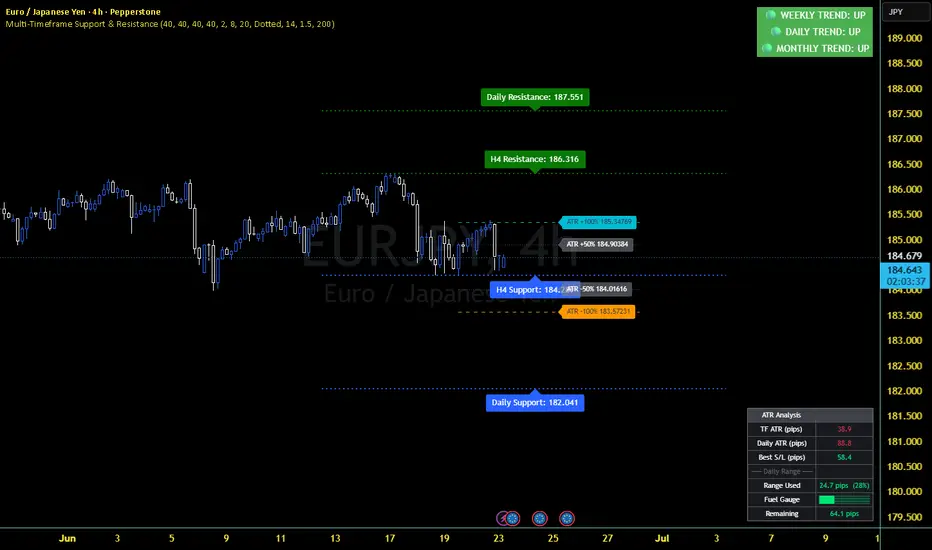
This indicator shows me the Daily ATR value as well as the current time frame ATR and to place my SL I use 1.5 * ATR(The current time frame ATR). With that I can avoid the SL chasers during the low volatility.
Also, based on the Daily ATR, I can see what was the total range (in pips and in %) and how many pips the price should move so I can have an idea the remaining pips I can get on a specific trade.
All those values are show in a table on my chart on the bottom right. There is a ”Fuel Gauge” for a more intuitive view about how many pips the price moved and how much “fuel” is still available.
I also added the ATR levels for not only place my SL but for a reference where price may be rejected. They are lines showing the % value for those levels and they work together with the Support and Resistance for Daily and H4. Those levels are some sort of “projections” based on the ATR.
The Main trend value for the 3 timeframes I check and they are located on the top right of my chart making easy to look so I know how the market may behave on my trading time frame(H4). One other thing on that feature is the colors. Uptrend is green and downtrend is red so if any one has a different color of the others I just move on and go to another pair.
Note that all those values and lines are customized and I have a full control to show or not them as well as change values if I think will improve my trade. This is a simple indicator that has been helping me trading Price Action.
Trading Price Action is a strategy that depends basically in levels where the price movement is rejected and those levels are called Support and Resistance.
- Support level happens when the price level move below the current price and find a level to prevent a further downward move due buyers step in pushing the price back upward.
- Resistance level happens when the price move above the current price and find a level that prevents the price move further up due sellers step in pushing the price back downward.
Based on the main market trend those levels can be used to identify possible entries (preferably in the same direction of the main trend) or they can be used for Stoploss and Take profit levels.
So based on those concepts and my decision to trade only Price Action I decided to develop this indicator. On it I can see the main trend for the higher time frames like Monthly, Weekly and Daily.
That information is important to help me understand how the market is behaving on those timeframes widely used by trading companies and improve my chances to be on the right side of the trend.
When I am analyzing the charts I look for the below points:
• what is the the main trends?
• then I drop for my entry timeframe;
• check for a rejection from Support or Resistance(based on the main trend direction);
• set my entry: pending Limit or Stop or market
• set your Stoploss and Take profit levels
• and, more important, wait for a new bar open.
To identify the Stoploss I use the ATR. The Average True Range measure market volatility meaning how much the market moved in a period of time and it is widely used for professional traders.
This indicator shows me the Daily ATR value as well as the current time frame ATR and to place my SL I use 1.5 * ATR(The current time frame ATR). With that I can avoid the SL chasers during the low volatility.
Also, based on the Daily ATR, I can see what was the total range (in pips and in %) and how many pips the price should move so I can have an idea the remaining pips I can get on a specific trade.
All those values are show in a table on my chart on the bottom right. There is a ”Fuel Gauge” for a more intuitive view about how many pips the price moved and how much “fuel” is still available.
I also added the ATR levels for not only place my SL but for a reference where price may be rejected. They are lines showing the % value for those levels and they work together with the Support and Resistance for Daily and H4. Those levels are some sort of “projections” based on the ATR.
The Main trend value for the 3 timeframes I check and they are located on the top right of my chart making easy to look so I know how the market may behave on my trading time frame(H4). One other thing on that feature is the colors. Uptrend is green and downtrend is red so if any one has a different color of the others I just move on and go to another pair.
Note that all those values and lines are customized and I have a full control to show or not them as well as change values if I think will improve my trade. This is a simple indicator that has been helping me trading Price Action.
Mã nguồn mở
Theo đúng tinh thần TradingView, tác giả của tập lệnh này đã công bố nó dưới dạng mã nguồn mở, để các nhà giao dịch có thể xem xét và xác minh chức năng. Chúc mừng tác giả! Mặc dù bạn có thể sử dụng miễn phí, hãy nhớ rằng việc công bố lại mã phải tuân theo Nội quy.

Thông báo miễn trừ trách nhiệm
Thông tin và các ấn phẩm này không nhằm mục đích, và không cấu thành, lời khuyên hoặc khuyến nghị về tài chính, đầu tư, giao dịch hay các loại khác do TradingView cung cấp hoặc xác nhận. Đọc thêm tại Điều khoản Sử dụng.
Mã nguồn mở
Theo đúng tinh thần TradingView, tác giả của tập lệnh này đã công bố nó dưới dạng mã nguồn mở, để các nhà giao dịch có thể xem xét và xác minh chức năng. Chúc mừng tác giả! Mặc dù bạn có thể sử dụng miễn phí, hãy nhớ rằng việc công bố lại mã phải tuân theo Nội quy.
Thông báo miễn trừ trách nhiệm
Thông tin và các ấn phẩm này không nhằm mục đích, và không cấu thành, lời khuyên hoặc khuyến nghị về tài chính, đầu tư, giao dịch hay các loại khác do TradingView cung cấp hoặc xác nhận. Đọc thêm tại Điều khoản Sử dụng.