Cập nhật
SMC Entry Signals MTF v3
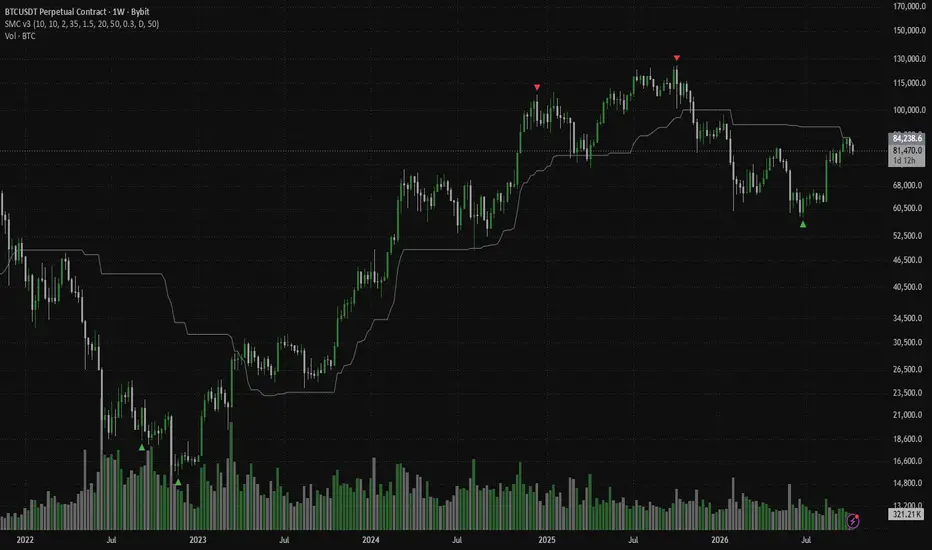
SMC Entry Signals MTF v3 marks reversal entries with Smart Money Concepts order blocks and keeps the familiar look of version 2: small green triangles below the candles for long entries, small red triangles above the candles for short entries, lime and maroon triangles for every raw order block, and the grey FIB 50 percent line of the recent range. The indicator works on any symbol and timeframe and needs no volume data.
A bullish order block is a candle that makes the lowest low of the last N bars and closes green. A bearish order block is a candle that makes the highest high of the last N bars and closes red. On their own these marks appear at almost every reversal, but also at many places where price simply kept going, so version 3 adds filters that decide which order blocks become entry signals. A long entry requires a bullish order block while price is at least 2 ATR below the 50 EMA and RSI(14) has been at or below 35 within the last five bars, which means the move down is stretched and selling is exhausted. A short entry requires a bearish order block formed by an imbalance candle whose red body covers at least 30 percent of its range, while price is at least 1.5 ATR above the 50 EMA and at least 20 percent above the low of the last 30 bars, which means the move up is stretched and sellers stepped in with force.
These filters were chosen by testing on daily bars of Bitcoin from 2011 and of 27 liquid altcoins from 2020. The settings were selected on the earlier years and checked on the later years, which took no part in the selection. A signal counted as a hit when it appeared within 8 percent of the extreme of a real 20 percent swing. On the later years the long and short entries hit such swings about 1.5 to 2.5 times more often than a random day, while the raw order blocks did so only 0.7 to 1.4 times as often. Entries are fewer than raw order blocks and do not mark every reversal, and no signal is right every time.
All the classic SMC components are still available as options for each side: the discount or premium zone relative to the FIB 50 percent level, the engulfing candle, the imbalance candle, the breaker block, where the close reclaims the level of the last opposite order block, and the multi-timeframe confirmation, which reads only the last completed higher-timeframe candle so it does not repaint. Every filter can be switched on or off and its threshold adjusted in the settings. A series of signals on one side counts once, with at least 10 bars between signals, and all signals are evaluated on closed bars. Alerts are available for long and short entries.
The indicator works best on daily and weekly charts, where it was tested. Use the entries together with your own levels, trend context and risk management. This script is an analytical tool for education and research and is not financial advice.
A bullish order block is a candle that makes the lowest low of the last N bars and closes green. A bearish order block is a candle that makes the highest high of the last N bars and closes red. On their own these marks appear at almost every reversal, but also at many places where price simply kept going, so version 3 adds filters that decide which order blocks become entry signals. A long entry requires a bullish order block while price is at least 2 ATR below the 50 EMA and RSI(14) has been at or below 35 within the last five bars, which means the move down is stretched and selling is exhausted. A short entry requires a bearish order block formed by an imbalance candle whose red body covers at least 30 percent of its range, while price is at least 1.5 ATR above the 50 EMA and at least 20 percent above the low of the last 30 bars, which means the move up is stretched and sellers stepped in with force.
These filters were chosen by testing on daily bars of Bitcoin from 2011 and of 27 liquid altcoins from 2020. The settings were selected on the earlier years and checked on the later years, which took no part in the selection. A signal counted as a hit when it appeared within 8 percent of the extreme of a real 20 percent swing. On the later years the long and short entries hit such swings about 1.5 to 2.5 times more often than a random day, while the raw order blocks did so only 0.7 to 1.4 times as often. Entries are fewer than raw order blocks and do not mark every reversal, and no signal is right every time.
All the classic SMC components are still available as options for each side: the discount or premium zone relative to the FIB 50 percent level, the engulfing candle, the imbalance candle, the breaker block, where the close reclaims the level of the last opposite order block, and the multi-timeframe confirmation, which reads only the last completed higher-timeframe candle so it does not repaint. Every filter can be switched on or off and its threshold adjusted in the settings. A series of signals on one side counts once, with at least 10 bars between signals, and all signals are evaluated on closed bars. Alerts are available for long and short entries.
The indicator works best on daily and weekly charts, where it was tested. Use the entries together with your own levels, trend context and risk management. This script is an analytical tool for education and research and is not financial advice.
Phát hành các Ghi chú
Added a setting to hide the raw order-block triangles, so the chart can show only the filtered long and short entries. It is on by default, so the look is unchanged unless you switch it off. The chart preview now shows the entries only.Phát hành các Ghi chú
Version 3.3. The raw order-block triangles (lime and maroon) are now off by default. Right after the indicator is added to a chart it shows only the filtered long and short entry triangles, the same rare reversal signals as in the chart preview. The signal logic is unchanged. The raw order blocks can still be switched on in Settings, group Display. If the indicator is already on your chart, it keeps its previous settings: remove it and add it again, or open Settings and choose Defaults, Reset settings.Phát hành các Ghi chú
Version 3.4, a note on accuracy. The signal logic is unchanged. The lift figures in the description measure how often a signal appears close to a real swing extreme: within a time window around the turn and within 8 % of its price. We have since tested the signals with a stricter, trade-like measure: does price move 2 ATR in the signal direction before it moves 1 ATR against it, within 30 days. By that measure the entries were not better than a random day, both on BTC (2011 to 2026) and on 27 liquid altcoins (2020 to 2026), in the selection years and in the later check years. Read the triangles as areas where a reversal is more likely to form, not as entries with a proven trading edge, and use your own confirmation and risk management.
Thông báo miễn trừ trách nhiệm
Thông tin và các ấn phẩm này không nhằm mục đích, và không cấu thành, lời khuyên hoặc khuyến nghị về tài chính, đầu tư, giao dịch hay các loại khác do TradingView cung cấp hoặc xác nhận. Đọc thêm tại Điều khoản Sử dụng.
Thông báo miễn trừ trách nhiệm
Thông tin và các ấn phẩm này không nhằm mục đích, và không cấu thành, lời khuyên hoặc khuyến nghị về tài chính, đầu tư, giao dịch hay các loại khác do TradingView cung cấp hoặc xác nhận. Đọc thêm tại Điều khoản Sử dụng.