Cập nhật
RobinHood Stochastics Oscillator RSI - RSOR
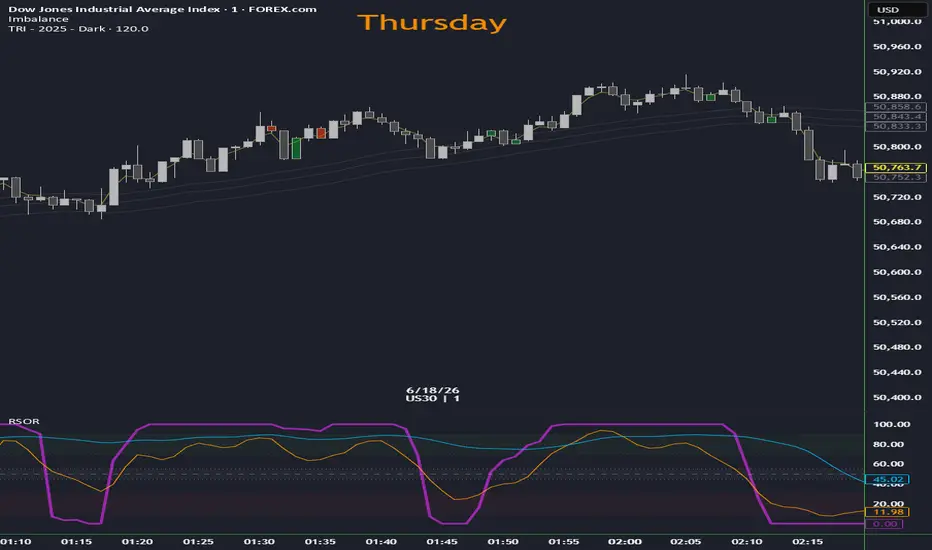
Overview This indicator is a complete Pine Script v6 port of the custom "RSOR" (RSI of EMA + Stochastics) indicator originally built for MT4 (MQL4). It combines a unique momentum calculation—RSI of EMA—with two distinct Stochastic oscillators (Fast and Slow) into a single, clean pane.
How It Works
How to Use It Traders can use this indicator to identify momentum exhaustion, divergences, and trend entries:
Visual Groupings and Zones To enhance readability without overpowering the price chart, the indicator features 3 distinct background zones with subtle opacity fills:
How It Works
- []RSI of EMA (Purple Line): Unlike the traditional Wilder's RSI, this script calculates the relative strength based on the difference between consecutive Exponential Moving Averages (EMA). It uses a custom "Simple Sum" logic to accumulate gains and losses over the specified period, making it highly reactive to momentum shifts. []Stochastic Fast & Slow: The indicator utilizes dual Stochastics. Both the Fast (Orange) and Slow (Blue) Stochastics are configured to smooth their %D signal lines using an EMA (mirroring the MODE_EMA parameter from MT4). The raw %K lines are hidden to reduce chart clutter, focusing strictly on the smoothed %D signal lines.
How to Use It Traders can use this indicator to identify momentum exhaustion, divergences, and trend entries:
- []Look for the RSI of EMA to cross into the extreme zones (above 70 or below 30) for potential reversal setups. []Use the direction and positioning of the Fast and Slow Stochastics relative to the neutral zone to gauge the primary trend.
- Confluence between the RSI of EMA and Stochastics leaving the shaded extreme zones provides high-probability entry signals.
Visual Groupings and Zones To enhance readability without overpowering the price chart, the indicator features 3 distinct background zones with subtle opacity fills:
- []Oversold Zone (10 - 30): Bounded by red dotted lines with a very light red background fill to indicate extreme downside momentum. []Neutral Zone (45 - 55): Bounded by white dotted/dashed lines with a light white background fill to define the midline chop zone.
- Overbought Zone (70 - 90): Bounded by green dotted lines with a light green background fill to indicate extreme upside momentum.
Phát hành các Ghi chú
Updated indicator's name
Thông báo miễn trừ trách nhiệm
Thông tin và các ấn phẩm này không nhằm mục đích, và không cấu thành, lời khuyên hoặc khuyến nghị về tài chính, đầu tư, giao dịch hay các loại khác do TradingView cung cấp hoặc xác nhận. Đọc thêm tại Điều khoản Sử dụng.
Thông báo miễn trừ trách nhiệm
Thông tin và các ấn phẩm này không nhằm mục đích, và không cấu thành, lời khuyên hoặc khuyến nghị về tài chính, đầu tư, giao dịch hay các loại khác do TradingView cung cấp hoặc xác nhận. Đọc thêm tại Điều khoản Sử dụng.