OPEN-SOURCE SCRIPT
Cập nhật [ A L P H A X ] Structure - Smart Money Concepts [SMC]
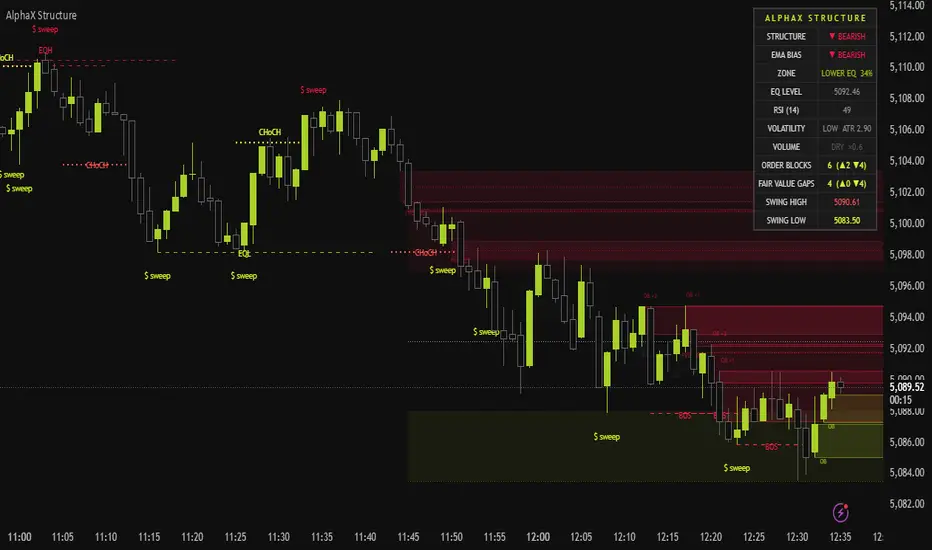
AlphaX Structure — Smart Money Concepts: BOS, CHoCH, Order Blocks, FVG, Liquidity Sweeps, Equal H/L, Displacement & Live Dashboard
AlphaX Structure is a comprehensive Smart Money Concepts (SMC) and ICT-methodology visualization tool that automatically maps market structure, institutional order flow zones, imbalances, and liquidity levels on your chart. It detects Break of Structure, Change of Character, Order Blocks with touch tracking, Fair Value Gaps with real-time fill percentage, liquidity sweeps, equal highs and lows, displacement candles, premium and discount zones — all presented through a clean, professional interface with a live dashboard showing market context at a glance.
Built for traders who analyze markets through the lens of institutional order flow and smart money behavior.
━━━━━━━━━━━━━━━━━━━━━━━━━━━━━━━━━━━━━━━━
📐 Market Structure — BOS & CHoCH
The foundation of smart money analysis is understanding where structure breaks and when character changes.
Break of Structure (BOS)
A BOS occurs when price breaks a swing high or swing low in the direction of the existing trend — confirming that the current trend is continuing. BOS is plotted as a dashed horizontal line at the broken level with a "BOS" label offset slightly above or below for clear visibility.
Change of Character (CHoCH)
A CHoCH occurs when price breaks a swing high or swing low against the direction of the existing trend — signaling a potential trend reversal. CHoCH is plotted as a dotted horizontal line (visually distinct from BOS) with a "CHoCH" label.
CHoCH is the earliest structural reversal signal. When you see a CHoCH followed by a BOS in the new direction, the trend shift is confirmed.
The indicator tracks the internal market trend state automatically. Once a bullish CHoCH fires, all subsequent structure breaks in the same direction are classified as BOS (continuation) until a bearish CHoCH resets the trend — and vice versa.
Swing Classification
When swing point labels are enabled, each pivot is classified as:
This gives you the complete market structure sequence — HH + HL = uptrend, LH + LL = downtrend — at a glance without manually marking swings.
━━━━━━━━━━━━━━━━━━━━━━━━━━━━━━━━━━━━━━━━
📦 Order Blocks (OB) — With Touch Tracking
Order Blocks are the last opposing candle before a strong move — the zone where institutional orders were placed. AlphaX Structure detects Order Blocks automatically using two methods:
Each Order Block is drawn as a filled box spanning the body of the origin candle. The box extends forward in time, remaining on the chart as a potential reaction zone.
What makes this unique — Touch Counting:
Most SMC indicators simply show or hide Order Blocks. AlphaX Structure tracks how many times price retests each Order Block and displays the count directly on the label:
This is critical information. A fresh OB with zero touches is the highest probability reaction zone. An OB that has been tested 3 or more times is significantly weaker — institutional orders at that level have likely been filled, and the zone may fail on the next test.
Mitigation:
When price closes through an Order Block (beyond its far edge), the OB is considered mitigated. It grays out and stops extending — visually clearing the chart while preserving the historical record of where the zone existed.
━━━━━━━━━━━━━━━━━━━━━━━━━━━━━━━━━━━━━━━━
⚡ Fair Value Gaps (FVG) — With Fill Percentage
A Fair Value Gap is a three-candle imbalance where the wick of the first candle and the wick of the third candle do not overlap — creating a gap in price that represents inefficient price delivery. These gaps act as magnets that price tends to return to and fill.
Each FVG is drawn as a dotted-border box with a midpoint line through the center. The midpoint represents the 50% level of the imbalance — often the precise level where price reacts.
What makes this unique — Real-Time Fill Percentage:
AlphaX Structure calculates and displays how much of each FVG has been filled as price returns to the zone:
This gives you precision that no standard FVG indicator provides. A gap that is 70% filled but holding at the midpoint is behaving differently than one that was filled in a single candle. The fill percentage helps you judge whether the imbalance has been respected (potential bounce) or is being aggressively closed (continuation through).
A minimum FVG size filter (in ticks) is available to remove insignificant micro-gaps that clutter the chart on lower timeframes.
━━━━━━━━━━━━━━━━━━━━━━━━━━━━━━━━━━━━━━━━
💰 Liquidity Sweeps
Liquidity sweeps occur when price wicks beyond a recent high or low but closes back inside the range — indicating a stop hunt or liquidity grab by institutional players. This is one of the most important concepts in ICT methodology.
The lookback period for defining "recent" highs and lows is configurable, allowing you to tune sensitivity from tight scalping sweeps to broader swing-level liquidity grabs.
Liquidity sweeps are most powerful when they occur at key levels — equal highs/lows, Order Block zones, or previous day/week extremes. When a sweep aligns with an OB or FVG, the probability of a reaction increases significantly.
━━━━━━━━━━━━━━━━━━━━━━━━━━━━━━━━━━━━━━━━
⚖ Equal Highs & Equal Lows (EQH / EQL)
When two consecutive swing highs or swing lows form at approximately the same price, they create a liquidity pool. Retail traders place stops just beyond these levels, and institutional players know exactly where those stops are clustered.
The tolerance for what counts as "equal" is configurable as a percentage (default 0.02%). This prevents false matches while catching genuinely significant double-top and double-bottom liquidity formations.
Equal Highs and Equal Lows are prime targets — when you see price approaching an EQH from below or an EQL from above, be prepared for either a sweep-and-reverse or a clean breakout. The market structure context (BOS vs CHoCH) and the presence of nearby Order Blocks will help you determine which scenario is more likely.
━━━━━━━━━━━━━━━━━━━━━━━━━━━━━━━━━━━━━━━━
🔥 Displacement Candles
Displacement represents aggressive institutional commitment — a candle whose body is significantly larger than normal, showing that smart money entered with force. AlphaX Structure identifies displacement candles using two criteria:
Bullish displacement candles are marked with a diamond below the bar. Bearish displacement candles are marked with a diamond above the bar.
Displacement candles are the engine behind structure breaks. When a BOS or CHoCH is accompanied by a displacement candle, the move has genuine institutional backing. When structure breaks occur on weak, indecisive candles, the break is more likely to fail.
Additionally, displacement candles often create Fair Value Gaps. When you see a displacement diamond next to an FVG box, you know the imbalance was created by a powerful move — making that FVG a higher-probability reaction zone.
━━━━━━━━━━━━━━━━━━━━━━━━━━━━━━━━━━━━━━━━
💪 Candle Strength Dots
An optional feature that marks individual candles based on their relative strength compared to the ATR:
This is a quick visual filter for identifying which candles represent genuine conviction versus noise. Disabled by default to keep the chart clean — enable it when you want granular candle-level analysis.
━━━━━━━━━━━━━━━━━━━━━━━━━━━━━━━━━━━━━━━━
🎯 Premium & Discount Zones
The indicator calculates the current trading range using a configurable lookback period and divides it into:
The Premium and Discount zones are drawn using boxes and lines that do not affect the chart's price scale — your candles will always display at their natural size regardless of the range lookback setting.
The dashboard displays your exact position within the range as a percentage: "DISCOUNT 18%" means price is in the lower 18% of the range — deep discount. "PREMIUM 85%" means price is in the upper portion — extended and vulnerable to pullback.
━━━━━━━━━━━━━━━━━━━━━━━━━━━━━━━━━━━━━━━━
📋 Live Dashboard
A comprehensive real-time reference panel that updates on every bar, providing complete market context without needing to scan the chart:
The dashboard title "A L P H A X S T R U C T U R E" is displayed in the signature yellow-green theme color. All values are color-coded to match their significance — bullish values in yellow-green, bearish values in red, neutral in gray.
Dashboard position (Top Left, Top Right, Bottom Left, Bottom Right) and text size (Tiny, Small, Normal) are fully configurable.
━━━━━━━━━━━━━━━━━━━━━━━━━━━━━━━━━━━━━━━━
🎨 Visual Design Philosophy
AlphaX Structure follows a strict dual-tone color theme for maximum clarity:
Structure labels (BOS, CHoCH, OB, FVG, EQH, EQL) are offset from their reference lines by a dynamic ATR-based spacing value. This ensures labels never sit directly on top of the lines they reference — maintaining readability at any zoom level and on any instrument.
All label sizes are configurable from a single setting (Tiny, Small, Normal, Large), and structure line widths for BOS and CHoCH are independently adjustable.
Mitigated zones are visually dimmed — OB and FVG boxes turn gray with increased transparency, clearly distinguishing active zones from historical ones without removing them from the chart entirely.
━━━━━━━━━━━━━━━━━━━━━━━━━━━━━━━━━━━━━━━━
🚀 How to Read AlphaX Structure — Step by Step
Step 1 — Identify the Trend
Step 2 — Locate Key Levels
Step 3 — Determine Premium or Discount
Step 4 — Wait for Confluence
Step 5 — Monitor Displacement
Step 6 — Track FVG Fill Progress
Step 7 — Count OB Touches
━━━━━━━━━━━━━━━━━━━━━━━━━━━━━━━━━━━━━━━━
⚡ Key Features Summary
━━━━━━━━━━━━━━━━━━━━━━━━━━━━━━━━━━━━━━━━
⚙ Settings Reference
Structure
Order Blocks
Fair Value Gaps
Liquidity
Equal H/L
Premium & Discount
Displacement
Candle Strength
Appearance
Dashboard
━━━━━━━━━━━━━━━━━━━━━━━━━━━━━━━━━━━━━━━━
🔔 Alert Conditions (18 Total)
Individual Alerts:
Combined Alerts:
All alert messages are prefixed with [AlphaX] and include ticker, interval, and price for clean webhook and notification integration.
━━━━━━━━━━━━━━━━━━━━━━━━━━━━━━━━━━━━━━━━
👥 Who This Is For
━━━━━━━━━━━━━━━━━━━━━━━━━━━━━━━━━━━━━━━━
📝 Notes
━━━━━━━━━━━━━━━━━━━━━━━━━━━━━━━━━━━━━━━━
⚠ Disclaimer
This indicator is a technical analysis and visualization tool intended for educational and informational purposes only. It does not constitute financial advice or a recommendation to buy or sell any financial instrument. All structure levels, Order Blocks, Fair Value Gaps, and liquidity levels shown are derived from historical price data and their significance as support, resistance, or reaction zones is not guaranteed. Smart Money Concepts and ICT methodology are interpretive frameworks — they describe market behavior patterns but do not predict future price action with certainty. Past reactions at these levels do not guarantee future reactions. Always conduct your own analysis, use proper risk management, and consult a licensed financial advisor before making any trading decisions. The author accepts no responsibility for any losses incurred from the use of this indicator.
━━━━━━━━━━━━━━━━━━━━━━━━━━━━━━━━━━━━━━━━
Built for traders who read the market the way institutions move it.
AlphaX Structure is a comprehensive Smart Money Concepts (SMC) and ICT-methodology visualization tool that automatically maps market structure, institutional order flow zones, imbalances, and liquidity levels on your chart. It detects Break of Structure, Change of Character, Order Blocks with touch tracking, Fair Value Gaps with real-time fill percentage, liquidity sweeps, equal highs and lows, displacement candles, premium and discount zones — all presented through a clean, professional interface with a live dashboard showing market context at a glance.
Built for traders who analyze markets through the lens of institutional order flow and smart money behavior.
━━━━━━━━━━━━━━━━━━━━━━━━━━━━━━━━━━━━━━━━
📐 Market Structure — BOS & CHoCH
The foundation of smart money analysis is understanding where structure breaks and when character changes.
Break of Structure (BOS)
A BOS occurs when price breaks a swing high or swing low in the direction of the existing trend — confirming that the current trend is continuing. BOS is plotted as a dashed horizontal line at the broken level with a "BOS" label offset slightly above or below for clear visibility.
- Bullish BOS — price closes above a prior swing high while the market is already in a bullish structure. This confirms buyers remain in control and the uptrend is intact.
- Bearish BOS — price closes below a prior swing low while the market is already in a bearish structure. This confirms sellers remain dominant and the downtrend continues.
Change of Character (CHoCH)
A CHoCH occurs when price breaks a swing high or swing low against the direction of the existing trend — signaling a potential trend reversal. CHoCH is plotted as a dotted horizontal line (visually distinct from BOS) with a "CHoCH" label.
- Bullish CHoCH — price closes above a swing high while the market was previously bearish. This is the first structural sign that sellers may have lost control and a bullish reversal is forming.
- Bearish CHoCH — price closes below a swing low while the market was previously bullish. This warns that buyers may be exhausted and a bearish reversal could be underway.
CHoCH is the earliest structural reversal signal. When you see a CHoCH followed by a BOS in the new direction, the trend shift is confirmed.
The indicator tracks the internal market trend state automatically. Once a bullish CHoCH fires, all subsequent structure breaks in the same direction are classified as BOS (continuation) until a bearish CHoCH resets the trend — and vice versa.
Swing Classification
When swing point labels are enabled, each pivot is classified as:
- HH — Higher High (bullish continuation)
- HL — Higher Low (bullish continuation)
- LH — Lower High (bearish continuation)
- LL — Lower Low (bearish continuation)
This gives you the complete market structure sequence — HH + HL = uptrend, LH + LL = downtrend — at a glance without manually marking swings.
━━━━━━━━━━━━━━━━━━━━━━━━━━━━━━━━━━━━━━━━
📦 Order Blocks (OB) — With Touch Tracking
Order Blocks are the last opposing candle before a strong move — the zone where institutional orders were placed. AlphaX Structure detects Order Blocks automatically using two methods:
- Engulfing Pattern Detection — a candle that fully engulfs the prior candle's body, indicating aggressive institutional entry
- Strong Displacement Detection — a candle that breaks through two prior bars' highs or lows, showing powerful directional commitment
Each Order Block is drawn as a filled box spanning the body of the origin candle. The box extends forward in time, remaining on the chart as a potential reaction zone.
What makes this unique — Touch Counting:
Most SMC indicators simply show or hide Order Blocks. AlphaX Structure tracks how many times price retests each Order Block and displays the count directly on the label:
- OB — fresh, untested Order Block
- OB ×1 — price has retested this zone once
- OB ×2 — price has retested this zone twice
- OB ×3+ — multiple retests — the zone is weakening
This is critical information. A fresh OB with zero touches is the highest probability reaction zone. An OB that has been tested 3 or more times is significantly weaker — institutional orders at that level have likely been filled, and the zone may fail on the next test.
Mitigation:
When price closes through an Order Block (beyond its far edge), the OB is considered mitigated. It grays out and stops extending — visually clearing the chart while preserving the historical record of where the zone existed.
━━━━━━━━━━━━━━━━━━━━━━━━━━━━━━━━━━━━━━━━
⚡ Fair Value Gaps (FVG) — With Fill Percentage
A Fair Value Gap is a three-candle imbalance where the wick of the first candle and the wick of the third candle do not overlap — creating a gap in price that represents inefficient price delivery. These gaps act as magnets that price tends to return to and fill.
- Bullish FVG — gap between the high of candle 1 and the low of candle 3 (upward imbalance). Price tends to pull back down to fill this gap before continuing higher.
- Bearish FVG — gap between the low of candle 1 and the high of candle 3 (downward imbalance). Price tends to push back up to fill this gap before continuing lower.
Each FVG is drawn as a dotted-border box with a midpoint line through the center. The midpoint represents the 50% level of the imbalance — often the precise level where price reacts.
What makes this unique — Real-Time Fill Percentage:
AlphaX Structure calculates and displays how much of each FVG has been filled as price returns to the zone:
- FVG — unfilled gap, no price has entered the zone
- FVG 35% — price has partially filled 35% of the gap
- FVG 72% — price has filled most of the gap
- FVG ✓ — gap has been fully mitigated (price closed through the entire zone)
This gives you precision that no standard FVG indicator provides. A gap that is 70% filled but holding at the midpoint is behaving differently than one that was filled in a single candle. The fill percentage helps you judge whether the imbalance has been respected (potential bounce) or is being aggressively closed (continuation through).
A minimum FVG size filter (in ticks) is available to remove insignificant micro-gaps that clutter the chart on lower timeframes.
━━━━━━━━━━━━━━━━━━━━━━━━━━━━━━━━━━━━━━━━
💰 Liquidity Sweeps
Liquidity sweeps occur when price wicks beyond a recent high or low but closes back inside the range — indicating a stop hunt or liquidity grab by institutional players. This is one of the most important concepts in ICT methodology.
- Buy-side Sweep — price wicks above the recent highest high (grabbing buy-stop liquidity) but closes back below with a bearish candle. This often precedes a reversal lower. Labeled as "$ sweep" above the bar.
- Sell-side Sweep — price wicks below the recent lowest low (grabbing sell-stop liquidity) but closes back above with a bullish candle. This often precedes a reversal higher. Labeled as "$ sweep" below the bar.
The lookback period for defining "recent" highs and lows is configurable, allowing you to tune sensitivity from tight scalping sweeps to broader swing-level liquidity grabs.
Liquidity sweeps are most powerful when they occur at key levels — equal highs/lows, Order Block zones, or previous day/week extremes. When a sweep aligns with an OB or FVG, the probability of a reaction increases significantly.
━━━━━━━━━━━━━━━━━━━━━━━━━━━━━━━━━━━━━━━━
⚖ Equal Highs & Equal Lows (EQH / EQL)
When two consecutive swing highs or swing lows form at approximately the same price, they create a liquidity pool. Retail traders place stops just beyond these levels, and institutional players know exactly where those stops are clustered.
- EQH (Equal Highs) — two swing highs at nearly identical prices. A dashed line extends forward marking this level as a target for buy-side liquidity sweeps. Market makers frequently drive price above equal highs to trigger stops before reversing.
- EQL (Equal Lows) — two swing lows at nearly identical prices. A dashed line marks this as a sell-side liquidity target. Expect price to sweep below before potentially reversing.
The tolerance for what counts as "equal" is configurable as a percentage (default 0.02%). This prevents false matches while catching genuinely significant double-top and double-bottom liquidity formations.
Equal Highs and Equal Lows are prime targets — when you see price approaching an EQH from below or an EQL from above, be prepared for either a sweep-and-reverse or a clean breakout. The market structure context (BOS vs CHoCH) and the presence of nearby Order Blocks will help you determine which scenario is more likely.
━━━━━━━━━━━━━━━━━━━━━━━━━━━━━━━━━━━━━━━━
🔥 Displacement Candles
Displacement represents aggressive institutional commitment — a candle whose body is significantly larger than normal, showing that smart money entered with force. AlphaX Structure identifies displacement candles using two criteria:
- The candle body must exceed the Average True Range (ATR) multiplied by a configurable factor (default 2.0×)
- The body must occupy more than 60% of the total candle range (strong body-to-wick ratio — institutional candles close near their extreme, not in the middle)
Bullish displacement candles are marked with a diamond below the bar. Bearish displacement candles are marked with a diamond above the bar.
Displacement candles are the engine behind structure breaks. When a BOS or CHoCH is accompanied by a displacement candle, the move has genuine institutional backing. When structure breaks occur on weak, indecisive candles, the break is more likely to fail.
Additionally, displacement candles often create Fair Value Gaps. When you see a displacement diamond next to an FVG box, you know the imbalance was created by a powerful move — making that FVG a higher-probability reaction zone.
━━━━━━━━━━━━━━━━━━━━━━━━━━━━━━━━━━━━━━━━
💪 Candle Strength Dots
An optional feature that marks individual candles based on their relative strength compared to the ATR:
- Strong Bullish Candle — body exceeds 1.2× ATR with body ratio above 55%, bullish close. Dot appears below the bar.
- Strong Bearish Candle — same criteria, bearish close. Dot appears above the bar.
This is a quick visual filter for identifying which candles represent genuine conviction versus noise. Disabled by default to keep the chart clean — enable it when you want granular candle-level analysis.
━━━━━━━━━━━━━━━━━━━━━━━━━━━━━━━━━━━━━━━━
🎯 Premium & Discount Zones
The indicator calculates the current trading range using a configurable lookback period and divides it into:
- Premium Zone — the upper 25% of the range, shaded with the bear color. In ICT methodology, the premium zone is where smart money sells. Buying in premium is inherently risky.
- Discount Zone — the lower 25% of the range, shaded with the bull color. This is where smart money buys. Selling in discount is inherently risky.
- Equilibrium (EQ) — the exact 50% midpoint of the range, marked with a dotted cross line. This is the fair value level. Price above EQ is in premium territory; price below EQ is in discount territory.
The Premium and Discount zones are drawn using boxes and lines that do not affect the chart's price scale — your candles will always display at their natural size regardless of the range lookback setting.
The dashboard displays your exact position within the range as a percentage: "DISCOUNT 18%" means price is in the lower 18% of the range — deep discount. "PREMIUM 85%" means price is in the upper portion — extended and vulnerable to pullback.
━━━━━━━━━━━━━━━━━━━━━━━━━━━━━━━━━━━━━━━━
📋 Live Dashboard
A comprehensive real-time reference panel that updates on every bar, providing complete market context without needing to scan the chart:
- STRUCTURE — current market structure direction: ▲ BULLISH, ▼ BEARISH, or — NEUTRAL, based on the most recent BOS or CHoCH
- EMA BIAS — longer-term directional bias based on price position relative to 50 and 200 EMA alignment
- ZONE — whether price is currently in PREMIUM, UPPER EQ, LOWER EQ, or DISCOUNT territory, with exact percentage
- EQ LEVEL — the exact price of the current range equilibrium, formatted to the instrument's tick size
- RSI (14) — current RSI value, color-coded: green in oversold territory, red in overbought, neutral in the middle
- VOLATILITY — current volatility regime (HIGH / NORMAL / LOW) based on ATR as a percentage of price, with the exact ATR value
- VOLUME — current volume relative to the 20-period average: SPIKE (>2×), ABOVE AVG (>1.3×), NORMAL, or DRY (<0.7×)
- ORDER BLOCKS — number of currently active (unmitigated) Order Blocks, broken down by bullish and bearish count
- FAIR VALUE GAPS — number of currently active (unfilled) FVGs, broken down by bullish and bearish count
- SWING HIGH — the most recent confirmed swing high price
- SWING LOW — the most recent confirmed swing low price
The dashboard title "A L P H A X S T R U C T U R E" is displayed in the signature yellow-green theme color. All values are color-coded to match their significance — bullish values in yellow-green, bearish values in red, neutral in gray.
Dashboard position (Top Left, Top Right, Bottom Left, Bottom Right) and text size (Tiny, Small, Normal) are fully configurable.
━━━━━━━━━━━━━━━━━━━━━━━━━━━━━━━━━━━━━━━━
🎨 Visual Design Philosophy
AlphaX Structure follows a strict dual-tone color theme for maximum clarity:
- Yellow-Green (#c8e624) — all bullish elements: bullish BOS, bullish OBs, bullish FVGs, equal lows, discount zones, bullish displacement, sweep recoveries
- Red (#ff1744) — all bearish elements: bearish BOS, bearish OBs, bearish FVGs, equal highs, premium zones, bearish displacement, sweep rejections
- Gray (#555555) — neutral and mitigated elements: mitigated OBs and FVGs, equilibrium line, inactive zones
Structure labels (BOS, CHoCH, OB, FVG, EQH, EQL) are offset from their reference lines by a dynamic ATR-based spacing value. This ensures labels never sit directly on top of the lines they reference — maintaining readability at any zoom level and on any instrument.
All label sizes are configurable from a single setting (Tiny, Small, Normal, Large), and structure line widths for BOS and CHoCH are independently adjustable.
Mitigated zones are visually dimmed — OB and FVG boxes turn gray with increased transparency, clearly distinguishing active zones from historical ones without removing them from the chart entirely.
━━━━━━━━━━━━━━━━━━━━━━━━━━━━━━━━━━━━━━━━
🚀 How to Read AlphaX Structure — Step by Step
Step 1 — Identify the Trend
- Check the dashboard: what does STRUCTURE say? What does EMA BIAS say?
- If both agree (both bullish or both bearish), you have a confirmed directional environment
- If they disagree, the market may be in transition — wait for alignment
Step 2 — Locate Key Levels
- Identify active Order Blocks — these are your primary reaction zones
- Note any unfilled FVGs — price is likely to return to these imbalances
- Check for Equal Highs or Equal Lows — these are liquidity targets
Step 3 — Determine Premium or Discount
- Check the ZONE reading in the dashboard
- In a bullish trend, look for entries in DISCOUNT or LOWER EQ
- In a bearish trend, look for entries in PREMIUM or UPPER EQ
- Avoid entering long in deep premium or short in deep discount — you are fighting the range
Step 4 — Wait for Confluence
- The highest probability setups occur when multiple elements align at the same price level
- Example: A bullish OB with zero touches sitting inside the discount zone, with an unfilled bullish FVG overlapping the same area, and a recent sell-side liquidity sweep just below — this is a textbook smart money long entry
- Example: A bearish CHoCH forms at a premium zone equal high, followed by a displacement candle creating a bearish FVG — this is a high-probability short setup
Step 5 — Monitor Displacement
- When structure breaks occur, check for displacement diamonds
- BOS or CHoCH with displacement = high conviction move
- BOS or CHoCH without displacement = weaker break, may fail or consolidate
Step 6 — Track FVG Fill Progress
- As price returns to an FVG, watch the fill percentage update in real time
- If price fills to 50% (the midpoint line) and rejects — the FVG is acting as support or resistance
- If price fills beyond 70% — the imbalance is mostly resolved, the level is losing significance
- If the label shows "FVG ✓" — the gap is fully mitigated, it is no longer a valid zone
Step 7 — Count OB Touches
- Fresh OBs (zero touches) are the strongest — institutional orders are still there
- OBs with 1–2 touches are still valid but weakening
- OBs with 3+ touches — expect the zone to break on the next test. Consider trading the break rather than the bounce
━━━━━━━━━━━━━━━━━━━━━━━━━━━━━━━━━━━━━━━━
⚡ Key Features Summary
- 📐 Automatic Break of Structure (BOS) and Change of Character (CHoCH) detection with proper trend state tracking
- 📦 Order Blocks with real-time touch counting — know exactly how many times each zone has been tested
- ⚡ Fair Value Gaps with live fill percentage — see partial fills update as price enters the zone
- ✓ FVG mitigation checkmark — clear visual confirmation when an imbalance is fully resolved
- 💰 Liquidity sweep detection — buy-side and sell-side stop hunts automatically identified
- ⚖ Equal Highs and Equal Lows — institutional liquidity pool targets marked with extension lines
- 🔥 Displacement candle detection — identify the high-conviction institutional candles behind structure breaks
- 💪 Optional candle strength dots — quick visual filter for strong vs weak bars
- 🎯 Premium and Discount zones with equilibrium line — know whether you are buying cheap or expensive
- 📋 12-row live dashboard — structure, EMA bias, zone, RSI, volatility, volume, active OB/FVG counts, swing levels
- 🏷 HH / HL / LH / LL swing classification labels — complete market structure sequence at a glance
- 🎨 Clean dual-tone color theme — yellow-green bullish, red bearish, gray neutral — no visual clutter
- 📏 ATR-based label spacing — labels never overlap their reference lines regardless of instrument or timeframe
- ⚙ Fully configurable — label size, line widths, max drawings, transparency, lookback periods, all from the settings panel
- 🔔 18 alert conditions covering every event type including combined alerts for multi-condition monitoring
━━━━━━━━━━━━━━━━━━━━━━━━━━━━━━━━━━━━━━━━
⚙ Settings Reference
Structure
- Swing Detection Length — number of bars on each side to confirm a pivot (default: 5)
- Show Break of Structure — toggle BOS lines and labels
- Show Change of Character — toggle CHoCH lines and labels
- Show Swing Points — toggle HH/HL/LH/LL labels at pivots
- Max Structure Lines — limit on total BOS/CHoCH drawings (default: 15)
Order Blocks
- Show Order Blocks — toggle OB detection and drawing
- Remove Mitigated OBs — gray out and stop extending OBs that price has closed through
- Max Order Blocks — maximum active OB drawings (default: 8)
- Bullish / Bearish OB Color — independent color pickers
- OB Fill Transparency — control how transparent the OB fill appears (default: 88)
Fair Value Gaps
- Show Fair Value Gaps — toggle FVG detection and drawing
- Remove Mitigated FVGs — gray out and checkmark FVGs that price has fully closed through
- Max FVG Boxes — maximum active FVG drawings (default: 10)
- Bullish / Bearish FVG Color — independent color pickers
- FVG Fill Transparency — control fill transparency (default: 90)
- Min FVG Size (ticks) — filter out micro-gaps below this threshold
Liquidity
- Show Liquidity Sweeps — toggle sweep detection labels
- Liquidity Lookback — how many bars to look back for the recent high/low that defines the sweep level (default: 20)
- Buy-side / Sell-side Sweep Color — independent color pickers
Equal H/L
- Show Equal Highs / Lows — toggle EQH/EQL detection
- Equal Level Tolerance % — how close two swing pivots must be to qualify as "equal" (default: 0.02%)
- Equal Highs / Lows Color — independent color pickers
Premium & Discount
- Show Premium/Discount — toggle zone boxes and equilibrium line
- Range Lookback — how many bars to calculate the current range (default: 50)
- Discount / Premium Zone Color — independent color pickers
Displacement
- Show Displacement Candles — toggle displacement diamond markers
- ATR Multiplier — how many times larger than ATR the candle body must be (default: 2.0)
- ATR Period — the ATR calculation period (default: 14)
- Bull / Bear Displacement Color — independent color pickers
Candle Strength
- Show Candle Strength Dots — toggle strong candle markers (default: off)
- Strength ATR Period — ATR period for strength comparison (default: 14)
Appearance
- Label Size — Tiny, Small, Normal, or Large for all chart labels
- Structure Line Width — thickness of BOS lines (default: 1)
- CHoCH Line Width — thickness of CHoCH lines (default: 2)
Dashboard
- Show Dashboard — toggle the information panel
- Dashboard Position — Top Left, Top Right, Bottom Left, or Bottom Right
- Dashboard Text Size — Tiny, Small, or Normal
━━━━━━━━━━━━━━━━━━━━━━━━━━━━━━━━━━━━━━━━
🔔 Alert Conditions (18 Total)
Individual Alerts:
- Bullish BOS — fires when a bullish Break of Structure is confirmed
- Bearish BOS — fires when a bearish Break of Structure is confirmed
- Bullish CHoCH — fires when a bullish Change of Character is detected
- Bearish CHoCH — fires when a bearish Change of Character is detected
- Buy-side Liquidity Sweep — fires when price sweeps above recent highs and closes back below
- Sell-side Liquidity Sweep — fires when price sweeps below recent lows and closes back above
- Bullish FVG Formed — fires when a new bullish Fair Value Gap is created
- Bearish FVG Formed — fires when a new bearish Fair Value Gap is created
- Bullish OB Formed — fires when a new bullish Order Block is detected
- Bearish OB Formed — fires when a new bearish Order Block is detected
- Bullish Displacement — fires when a bullish displacement candle is confirmed
- Bearish Displacement — fires when a bearish displacement candle is confirmed
Combined Alerts:
- Any Bullish Structure Break — fires on either bullish BOS or bullish CHoCH
- Any Bearish Structure Break — fires on either bearish BOS or bearish CHoCH
- Any Liquidity Sweep — fires on either buy-side or sell-side sweep
- Any FVG Formed — fires on either bullish or bearish FVG
- Any OB Formed — fires on either bullish or bearish Order Block
- Any Displacement Candle — fires on either bullish or bearish displacement
All alert messages are prefixed with [AlphaX] and include ticker, interval, and price for clean webhook and notification integration.
━━━━━━━━━━━━━━━━━━━━━━━━━━━━━━━━━━━━━━━━
👥 Who This Is For
- 🧠 ICT and SMC traders — every core concept is mapped automatically: BOS, CHoCH, OB, FVG, liquidity sweeps, EQH/EQL, premium/discount, displacement
- 🥇 Gold (XAUUSD) traders — gold's price action is heavily driven by institutional order flow and liquidity sweeps; this tool maps exactly where those events occur
- 📉 Forex traders — applicable to all major and minor pairs; session-based liquidity sweeps are particularly effective on EURUSD, GBPUSD, and USDJPY
- 📊 Index traders — works on US30, NAS100, SPX500, DAX — Order Blocks and FVGs are core institutional concepts on indices
- 📈 Traders who want clean charts — every element uses the same dual-tone theme with proper spacing, mitigation graying, and configurable drawing limits. No clutter, no overlapping elements
- ⚠ Traders learning SMC methodology — the indicator maps every concept in real time, making it an excellent study tool for understanding how structure, order flow, and liquidity interact
━━━━━━━━━━━━━━━━━━━━━━━━━━━━━━━━━━━━━━━━
📝 Notes
- Designed for intraday to swing timeframes — M1 through H4. Works on daily and weekly charts but intraday timeframes provide the best resolution for OB and FVG detection.
- Premium and Discount zones are drawn using boxes and lines on the last bar only — they do not affect the chart's vertical price scale. Your candles will always display at their natural size.
- Structure detection uses bar close confirmation — a swing high or low must be confirmed by the configured number of bars on each side before it is recognized as a pivot.
- The maximum number of drawings for OBs, FVGs, structure lines, and EQ lines are all independently configurable. Older drawings beyond the limit are automatically removed.
- Touch counting on Order Blocks uses a de-duplication method — price must leave the OB zone and re-enter to count as a new touch. Consecutive bars inside the same OB count as one touch.
- FVG fill percentage is calculated based on the deepest penetration into the gap — even if price subsequently leaves the zone, the fill percentage reflects the maximum penetration achieved.
- All calculations are non-repainting — signals are confirmed on bar close.
━━━━━━━━━━━━━━━━━━━━━━━━━━━━━━━━━━━━━━━━
⚠ Disclaimer
This indicator is a technical analysis and visualization tool intended for educational and informational purposes only. It does not constitute financial advice or a recommendation to buy or sell any financial instrument. All structure levels, Order Blocks, Fair Value Gaps, and liquidity levels shown are derived from historical price data and their significance as support, resistance, or reaction zones is not guaranteed. Smart Money Concepts and ICT methodology are interpretive frameworks — they describe market behavior patterns but do not predict future price action with certainty. Past reactions at these levels do not guarantee future reactions. Always conduct your own analysis, use proper risk management, and consult a licensed financial advisor before making any trading decisions. The author accepts no responsibility for any losses incurred from the use of this indicator.
━━━━━━━━━━━━━━━━━━━━━━━━━━━━━━━━━━━━━━━━
Built for traders who read the market the way institutions move it.
Phát hành các Ghi chú
Minor style changes.Mã nguồn mở
Theo đúng tinh thần TradingView, tác giả của tập lệnh này đã công bố nó dưới dạng mã nguồn mở, để các nhà giao dịch có thể xem xét và xác minh chức năng. Chúc mừng tác giả! Mặc dù bạn có thể sử dụng miễn phí, hãy nhớ rằng việc công bố lại mã phải tuân theo Nội quy.

🌐 alphax.trading
Institutional Grade Signals --> Engineered for Retail
💎ᴠɪᴘ tradingview.com/v/TaXohZvb/
[ A L P H A X ] PRIME - Premium Signal Engine
🔢 alphax.trading/resources/calculators
AlphaX Calculators
Institutional Grade Signals --> Engineered for Retail
💎ᴠɪᴘ tradingview.com/v/TaXohZvb/
[ A L P H A X ] PRIME - Premium Signal Engine
🔢 alphax.trading/resources/calculators
AlphaX Calculators
Thông báo miễn trừ trách nhiệm
Thông tin và các ấn phẩm này không nhằm mục đích, và không cấu thành, lời khuyên hoặc khuyến nghị về tài chính, đầu tư, giao dịch hay các loại khác do TradingView cung cấp hoặc xác nhận. Đọc thêm tại Điều khoản Sử dụng.
Mã nguồn mở
Theo đúng tinh thần TradingView, tác giả của tập lệnh này đã công bố nó dưới dạng mã nguồn mở, để các nhà giao dịch có thể xem xét và xác minh chức năng. Chúc mừng tác giả! Mặc dù bạn có thể sử dụng miễn phí, hãy nhớ rằng việc công bố lại mã phải tuân theo Nội quy.
🌐 alphax.trading
Institutional Grade Signals --> Engineered for Retail
💎ᴠɪᴘ tradingview.com/v/TaXohZvb/
[ A L P H A X ] PRIME - Premium Signal Engine
🔢 alphax.trading/resources/calculators
AlphaX Calculators
Institutional Grade Signals --> Engineered for Retail
💎ᴠɪᴘ tradingview.com/v/TaXohZvb/
[ A L P H A X ] PRIME - Premium Signal Engine
🔢 alphax.trading/resources/calculators
AlphaX Calculators
Thông báo miễn trừ trách nhiệm
Thông tin và các ấn phẩm này không nhằm mục đích, và không cấu thành, lời khuyên hoặc khuyến nghị về tài chính, đầu tư, giao dịch hay các loại khác do TradingView cung cấp hoặc xác nhận. Đọc thêm tại Điều khoản Sử dụng.