OPEN-SOURCE SCRIPT
Stochastic with label OVS/OVB
Stochastic Oscillator
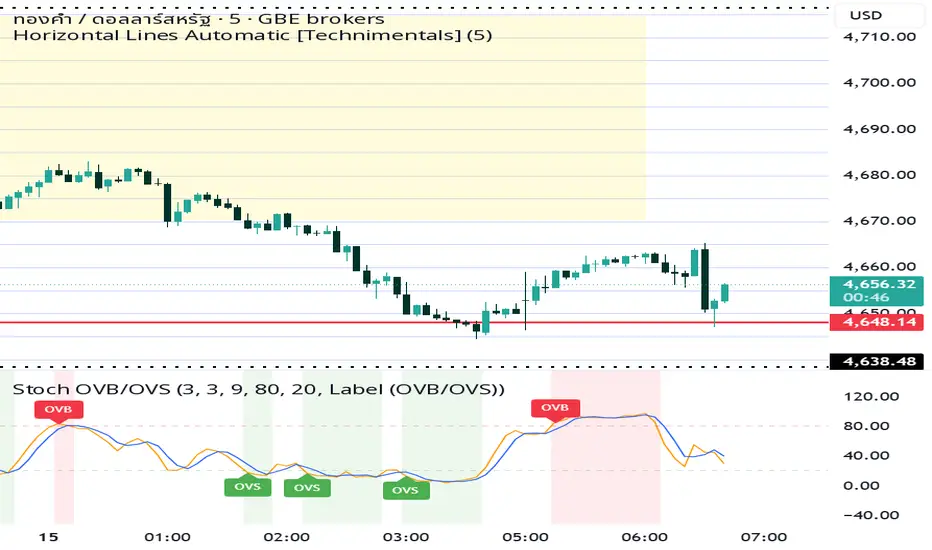
A Stochastic Oscillator indicator with OVB (Overbought) and OVS (Oversold) signal labels displayed beneath the price chart. The indicator uses two momentum lines — a blue %K line and an orange %D signal line — fluctuating between the 20 and 80 levels to identify market momentum and potential reversal zones. Red “OVB” labels appear when the oscillator enters the overbought region above 80, signaling possible bearish exhaustion, while green “OVS” labels appear below 20, indicating potential bullish reversal opportunities. The indicator is designed to help traders detect momentum shifts, trend weakness, and short-term entry or exit signals in fast-moving markets such as XAU/USD.
A Stochastic Oscillator indicator with OVB (Overbought) and OVS (Oversold) signal labels displayed beneath the price chart. The indicator uses two momentum lines — a blue %K line and an orange %D signal line — fluctuating between the 20 and 80 levels to identify market momentum and potential reversal zones. Red “OVB” labels appear when the oscillator enters the overbought region above 80, signaling possible bearish exhaustion, while green “OVS” labels appear below 20, indicating potential bullish reversal opportunities. The indicator is designed to help traders detect momentum shifts, trend weakness, and short-term entry or exit signals in fast-moving markets such as XAU/USD.
Mã nguồn mở
Theo đúng tinh thần TradingView, tác giả của tập lệnh này đã công bố nó dưới dạng mã nguồn mở, để các nhà giao dịch có thể xem xét và xác minh chức năng. Chúc mừng tác giả! Mặc dù bạn có thể sử dụng miễn phí, hãy nhớ rằng việc công bố lại mã phải tuân theo Nội quy.

Thông báo miễn trừ trách nhiệm
Thông tin và các ấn phẩm này không nhằm mục đích, và không cấu thành, lời khuyên hoặc khuyến nghị về tài chính, đầu tư, giao dịch hay các loại khác do TradingView cung cấp hoặc xác nhận. Đọc thêm tại Điều khoản Sử dụng.
Mã nguồn mở
Theo đúng tinh thần TradingView, tác giả của tập lệnh này đã công bố nó dưới dạng mã nguồn mở, để các nhà giao dịch có thể xem xét và xác minh chức năng. Chúc mừng tác giả! Mặc dù bạn có thể sử dụng miễn phí, hãy nhớ rằng việc công bố lại mã phải tuân theo Nội quy.
Thông báo miễn trừ trách nhiệm
Thông tin và các ấn phẩm này không nhằm mục đích, và không cấu thành, lời khuyên hoặc khuyến nghị về tài chính, đầu tư, giao dịch hay các loại khác do TradingView cung cấp hoặc xác nhận. Đọc thêm tại Điều khoản Sử dụng.