Liquidity Depth Walls [JOAT]
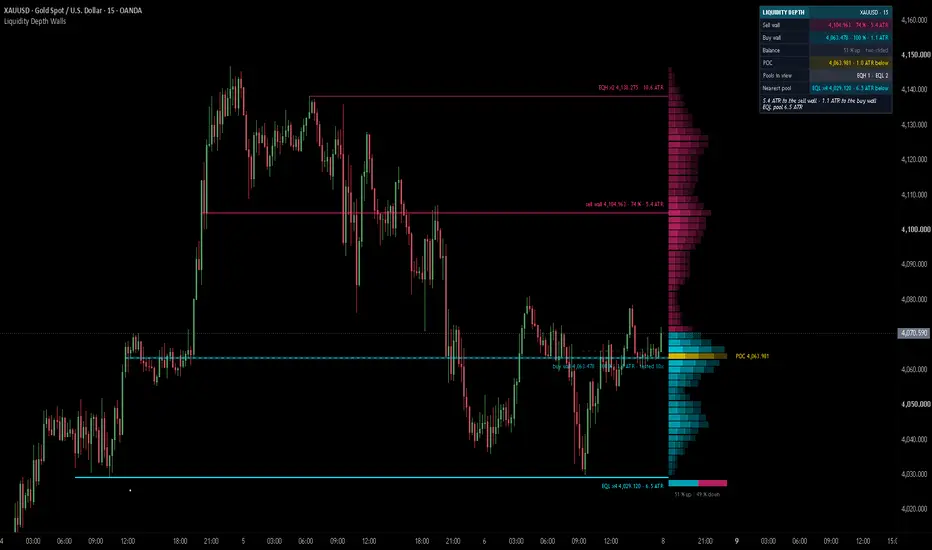
Liquidity Depth Walls is an open-source resting-liquidity map. It builds a volume-at-price ladder from the latest chart bars, draws it as a gradient histogram in the empty space to the right of price, and pulls the heaviest rows above and below price out as walls: a sell wall above, a buy wall below, each with its price, its strength and its distance in ATR written on the tag. Equal highs and equal lows, the obvious levels where stop orders tend to rest, are marked as pools with their swing count.
Nothing in it is a signal. It shows where volume was done and where equal swings sit, with the numbers on every object, and a dashboard that explains each number in plain words. Everything the dashboard reports is also drawn on the chart.

Core Concepts
1. The Depth Ladder
The ladder covers the high-low range of the last N bars, cut into price rows. Every bar's volume is spread evenly over the rows its range covers and summed per row; up-close and down-close volume are kept apart for the balance reading:
Pine Script®
The heaviest row is the point of control (POC). Rows above price are drawn in the bear colour, rows below price in the bull colour, the POC row in the accent colour. Each row is bright at its base and fades outward, and heavier rows are brighter, so the profile of the window reads at a glance. Rows outside the value area (the share of volume gathered around the POC) are a little fainter.
2. Walls
The strongest row above the close becomes the sell wall, the strongest below becomes the buy wall. Strength is that row's volume as a share of the POC row. A new wall must sit a minimum ATR distance from the close, so the row price is trading in right now is not called a wall. A live wall is only replaced by a row at least 10 % heavier, so two near-equal rows do not swap every bar. A wick into the row counts as a test (the line turns dashed and dimmer, the tag counts the tests); a bar that closes beyond the row's edge sweeps it: the line shrinks to a short dim dashed stub ending at the sweep bar, with no text unless you switch on "Swept tags", and leaves after 20 bars. Walls are born, dropped and swept on confirmed bars only.
3. Pools (equal highs / equal lows)
Confirmed swing highs within an ATR tolerance of each other form an EQH pool, confirmed swing lows an EQL pool. A further equal swing joins the pool and raises its count (EQH x3). A wick that goes past the pool by more than the tolerance sweeps it (the same dim stub as a swept wall); a wick inside the tolerance is one more equal swing. A lone swing that price has already traded through is forgotten, so a pool is never drawn at a level that was already taken.
4. Balance
The share of the ladder's volume printed by up-close bars. It is drawn as a two-tone bar under the ladder, tagged "58 % up · 42 % down" just under the bar, and reported on the dashboard with a plain reading: up-close volume leads, down-close volume leads, or two-sided.

Features
Input Parameters
Theme:
Limits (free account):
Dashboard:
Candles:
Depth ladder:
Walls:
Pools (equal highs / lows):
Tags:
Engine:
How to Use This Indicator
Reading the ladder
Long rows are prices where the window did a lot of business; short rows are prices it passed through quickly. The POC is the price the window accepted most. Price far from the POC is stretched against the window; price around it is in balance.
Reading the walls
A wall is the heaviest row on its side of price. Strength tells you how heavy it is against the POC, the ATR figure tells you how far away it is in today's volatility. A wall that has been tested several times without a close through shows that the volume there keeps meeting price; a wall that shrinks to a dim stub has been closed through (swept).
Reading the pools
Equal highs and equal lows are levels many participants can see, so stop orders tend to gather just beyond them. A higher count (x3, x4) means more swings stopped at the same level. A pool that shrinks to a dim stub has had a wick go past it (swept). Strong one-way moves sweep pools quickly, so "Pools in view 0" is a normal reading right after a trend leg.
Reading the dashboard
Hover any row for its explanation. The Read line repeats the key distances: to the sell wall, to the buy wall and to the nearest pool, all in ATR. Each value on the dashboard is the same number that is printed on the matching tag on the chart.
Indicator Limitations
Originality Statement
Disclaimer
This indicator is provided for educational and informational purposes only. It is not financial advice. Trading involves substantial risk of loss. Walls, pools and the depth ladder describe where volume traded and where swings formed in the past; they are not predictions of future price behaviour. The author accepts no responsibility for trading losses resulting from use of this indicator.
Made with passion by jackofalltrades
Nothing in it is a signal. It shows where volume was done and where equal swings sit, with the numbers on every object, and a dashboard that explains each number in plain words. Everything the dashboard reports is also drawn on the chart.
Core Concepts
1. The Depth Ladder
The ladder covers the high-low range of the last N bars, cut into price rows. Every bar's volume is spread evenly over the rows its range covers and summed per row; up-close and down-close volume are kept apart for the balance reading:
The heaviest row is the point of control (POC). Rows above price are drawn in the bear colour, rows below price in the bull colour, the POC row in the accent colour. Each row is bright at its base and fades outward, and heavier rows are brighter, so the profile of the window reads at a glance. Rows outside the value area (the share of volume gathered around the POC) are a little fainter.
2. Walls
The strongest row above the close becomes the sell wall, the strongest below becomes the buy wall. Strength is that row's volume as a share of the POC row. A new wall must sit a minimum ATR distance from the close, so the row price is trading in right now is not called a wall. A live wall is only replaced by a row at least 10 % heavier, so two near-equal rows do not swap every bar. A wick into the row counts as a test (the line turns dashed and dimmer, the tag counts the tests); a bar that closes beyond the row's edge sweeps it: the line shrinks to a short dim dashed stub ending at the sweep bar, with no text unless you switch on "Swept tags", and leaves after 20 bars. Walls are born, dropped and swept on confirmed bars only.
3. Pools (equal highs / equal lows)
Confirmed swing highs within an ATR tolerance of each other form an EQH pool, confirmed swing lows an EQL pool. A further equal swing joins the pool and raises its count (EQH x3). A wick that goes past the pool by more than the tolerance sweeps it (the same dim stub as a swept wall); a wick inside the tolerance is one more equal swing. A lone swing that price has already traded through is forgotten, so a pool is never drawn at a level that was already taken.
4. Balance
The share of the ladder's volume printed by up-close bars. It is drawn as a two-tone bar under the ladder, tagged "58 % up · 42 % down" just under the bar, and reported on the dashboard with a plain reading: up-close volume leads, down-close volume leads, or two-sided.
Features
- Depth ladder at the side of the chart: gradient histogram a few bars right of the last candle (or over the last bars), above-price rows in the bear colour, below-price rows in the bull colour, POC in the accent colour, heaviest rows brightest
- Wall tags with data: "sell wall 78,379.88 · 73 % · 1.4 ATR" at the base of the histogram, with "tested 2x" once wicks have reached it
- Dotted wall lines: from the bar where the row first traded to the histogram base, with glow halos on the strong walls
- Equal highs / lows pools: "EQH x3 24,550.25 · 0.8 ATR" in the high colour, "EQL x2 ..." in the low colour
- POC tag: a short "POC 24,550.25" right after the end of the POC row, sized to fit the chart's right margin; its distance in ATR is on the dashboard
- Balance bar: up-close versus down-close volume share under the ladder, with its tag just under the bar
- Clean swept history: a swept wall or pool shrinks to a short dim dashed stub ending at the sweep bar, with no text by default, and leaves after 20 bars; the grey "swept" tags are an option
- Dashboard with explanations: Sell wall, Buy wall, Balance, POC, Pools in view, Nearest pool and a one-line Read built from the numbers; every row has a tooltip that explains what it is and how liquidity readers use it
- Candle paint (optional): by the ladder's up-volume share or by the close's position between the walls; off by default
- Tag de-collision: tags in the same column reserve one text height each (scaled to the ladder's range on screen) and are moved to the nearest free slot, away from price first, so they never overlap; the tags nearest price keep their own row
- Readable everywhere: no tiny text; every tag and dashboard cell is Small or larger, and the dashboard's Read line wraps onto a second line when it gets long
- Seven themes: including a clean black / white preset where direction is carried by line style, and automatic white-chart adjustment
- Alerts: sell wall swept, buy wall swept, pool swept, new pool
- Free-account friendly: no request calls, drawings capped and retired oldest first, nothing anchored more than 4,990 bars back
Input Parameters
Theme:
- Theme: JOAT Signature, Midnight Blue / Red, Aurora Night, Delta Cyan / Pink, Paper & Ink, Lime Ember, Custom (default: Delta Cyan / Pink)
- Brightness: 1 faint to 5 vivid (default: 3)
- Chart background: Auto, Dark or Light (default: Auto)
- Custom bull / bear, accent / neutral, text / panel and glow colours (used by the Custom theme)
Limits (free account):
- Max boxes kept (default: 300), Max lines kept (default: 120), Max labels kept (default: 80)
Dashboard:
- Show dashboard, Dashboard position (default: Top Right), Dashboard size: Small, Normal or Large (default: Small), Compact dashboard, Tinted value cells
Candles:
- Candle paint: Off, Score or Mono (default: Off)
- Score from: Up-volume share or Position between walls (default: Up-volume share)
Depth ladder:
- Show depth ladder (default: on)
- Ladder placement: Right of price or Over the last bars (default: Right of price)
- Gap from the last bar (default: 3)
- Bars in the ladder (default: 200)
- Rows (default: 60)
- Ladder width in bars (default: 22; gap + width + the POC tag fit in about 38 bars of right margin)
- Gradient steps (default: 4)
- Value area % (default: 70)
- POC tag, Balance bar (default: on)
Walls:
- Show walls (default: on)
- Walls per side (default: 1)
- Minimum distance from price in ATR (default: 0.3)
- Glow from strength % (default: 60)
- Glow layers (default: 3)
- Extend right in bars, used when the ladder is hidden or over the last bars (default: 5)
- Keep swept objects in bars (default: 20)
- Swept tags: grey text on the swept stubs (default: off)
Pools (equal highs / lows):
- Show pools (default: on)
- Pivot left bars and Pivot right bars (default: 5 / 5)
- Equal tolerance in ATR (default: 0.2)
- Pair swings within bars (default: 300)
- Pools per side (default: 3)
- Retire pools after bars (default: 1000)
Tags:
- Price on tags, Strength % on wall tags, Distance in ATR on wall and pool tags, Tests count on wall tags (default: all on)
- Tag size: Small, Normal or Large (default: Small)
- Tag spacing in ATR (default: 0.5; at least 1/40 of the ladder's range is always reserved per tag)
Engine:
- Bars of history to compute (default: 1000)
How to Use This Indicator
Reading the ladder
Long rows are prices where the window did a lot of business; short rows are prices it passed through quickly. The POC is the price the window accepted most. Price far from the POC is stretched against the window; price around it is in balance.
Reading the walls
A wall is the heaviest row on its side of price. Strength tells you how heavy it is against the POC, the ATR figure tells you how far away it is in today's volatility. A wall that has been tested several times without a close through shows that the volume there keeps meeting price; a wall that shrinks to a dim stub has been closed through (swept).
Reading the pools
Equal highs and equal lows are levels many participants can see, so stop orders tend to gather just beyond them. A higher count (x3, x4) means more swings stopped at the same level. A pool that shrinks to a dim stub has had a wick go past it (swept). Strong one-way moves sweep pools quickly, so "Pools in view 0" is a normal reading right after a trend leg.
Reading the dashboard
Hover any row for its explanation. The Read line repeats the key distances: to the sell wall, to the buy wall and to the nearest pool, all in ATR. Each value on the dashboard is the same number that is printed on the matching tag on the chart.
Indicator Limitations
- The ladder is built from chart bars, not from order-book or tick data: each bar's volume is spread evenly over its high-low range, so the row volumes are an approximation of where volume traded
- Walls describe where volume traded in the past window; they are not resting orders and say nothing about future orders
- ATR distances use ATR(14) on the chart timeframe
- Pools need pivot confirmation, so a pool appears the configured number of right bars after its last swing
- On symbols without volume every bar weighs 1 and the ladder becomes time at price (marked "(time)")
- History is limited to the bars the chart loads (5,000 on a free account), and the walls are computed over the latest "Bars of history to compute" bars only
Originality Statement
- A volume-at-price ladder drawn as a per-row gradient histogram coloured by side of price, with the walls pulled from it carrying strength, ATR distance and test count on their tags, is combined here with equal highs / lows pools and a balance bar in one overlay
- Walls follow a live / tested / swept life cycle decided on confirmed bars, with a replacement threshold so near-equal rows do not swap every bar
- The dashboard explains every row in a tooltip and mirrors only numbers that are also printed on the chart
Disclaimer
This indicator is provided for educational and informational purposes only. It is not financial advice. Trading involves substantial risk of loss. Walls, pools and the depth ladder describe where volume traded and where swings formed in the past; they are not predictions of future price behaviour. The author accepts no responsibility for trading losses resulting from use of this indicator.
Made with passion by jackofalltrades

The Proven Highest Win Rate Trading Indicators, Strategies, Tools, + Signals !! 🃏
Get Access and See Full Results👇
jackofalltrades.vip 🌐
Get Access and See Full Results👇
jackofalltrades.vip 🌐
Thông báo miễn trừ trách nhiệm
Thông tin và các ấn phẩm này không nhằm mục đích, và không cấu thành, lời khuyên hoặc khuyến nghị về tài chính, đầu tư, giao dịch hay các loại khác do TradingView cung cấp hoặc xác nhận. Đọc thêm tại Điều khoản Sử dụng.
The Proven Highest Win Rate Trading Indicators, Strategies, Tools, + Signals !! 🃏
Get Access and See Full Results👇
jackofalltrades.vip 🌐
Get Access and See Full Results👇
jackofalltrades.vip 🌐
Thông báo miễn trừ trách nhiệm
Thông tin và các ấn phẩm này không nhằm mục đích, và không cấu thành, lời khuyên hoặc khuyến nghị về tài chính, đầu tư, giao dịch hay các loại khác do TradingView cung cấp hoặc xác nhận. Đọc thêm tại Điều khoản Sử dụng.