Cập nhật
OS RBEC RSI BWMA Extensions Channel
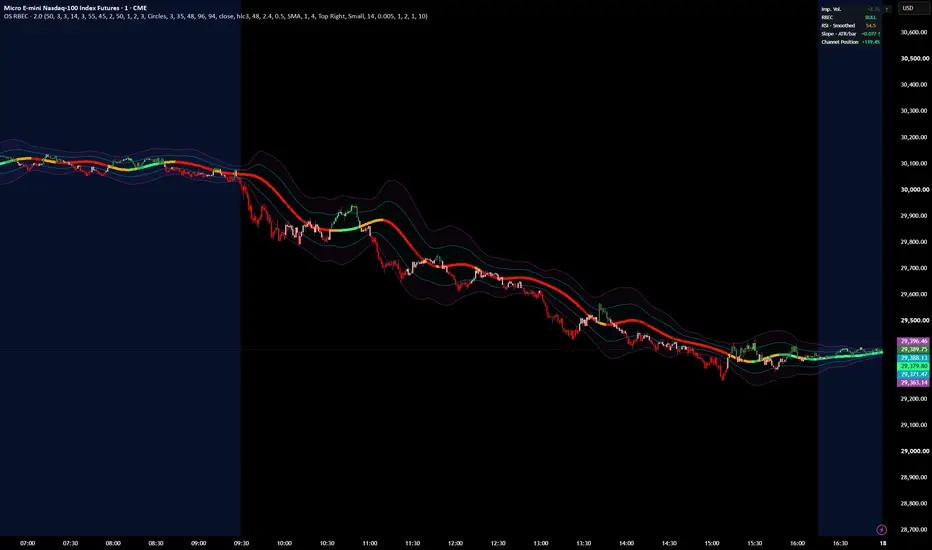
OS RBEC combines a Beta-Weighted Moving Average, RSI-based regime classification, and adaptive price channels. It presents trend direction, countertrend pressure, and price displacement in one chart overlay.
The centerline uses a Beta-Weighted Moving Average, with adjustable alpha and beta parameters controlling how historical prices are weighted. Its color reflects a regime determined by smoothed RSI, price’s position relative to the centerline, and the centerline’s slope.
Inner and outer channels adapt to the standard deviation of price’s distance from the centerline. This measures dispersion around the moving baseline rather than around a simple price average.
Features
- Adjustable BWMA length, alpha, beta, and price source.
- Configurable RSI length, smoothing, and bullish/bearish thresholds.
- Adjustable regime confirmation period.
- Bullish, bearish, and transition/counterpressure colors.
- Inner and outer deviation bands with adjustable multipliers.
- Customizable centerline style, colors, and channel fills.
How to interpret it:
The centerline provides a directional reference. Inner bands show the nearer channel boundaries, while outer bands highlight larger deviations from the baseline.
Transition coloring identifies counterpressure against the established regime; it does not itself confirm a reversal. Regime changes are committed on completed candles, while the channel and some color conditions can update during the current candle.
The bands are descriptive levels, not statistical confidence intervals or guaranteed support/resistance.
The centerline uses a Beta-Weighted Moving Average, with adjustable alpha and beta parameters controlling how historical prices are weighted. Its color reflects a regime determined by smoothed RSI, price’s position relative to the centerline, and the centerline’s slope.
Inner and outer channels adapt to the standard deviation of price’s distance from the centerline. This measures dispersion around the moving baseline rather than around a simple price average.
Features
- Adjustable BWMA length, alpha, beta, and price source.
- Configurable RSI length, smoothing, and bullish/bearish thresholds.
- Adjustable regime confirmation period.
- Bullish, bearish, and transition/counterpressure colors.
- Inner and outer deviation bands with adjustable multipliers.
- Customizable centerline style, colors, and channel fills.
How to interpret it:
The centerline provides a directional reference. Inner bands show the nearer channel boundaries, while outer bands highlight larger deviations from the baseline.
Transition coloring identifies counterpressure against the established regime; it does not itself confirm a reversal. Regime changes are committed on completed candles, while the channel and some color conditions can update during the current candle.
The bands are descriptive levels, not statistical confidence intervals or guaranteed support/resistance.
Phát hành các Ghi chú
OS RBEC with Imp. Vol. CandlesPurpose: This overlay combines the RSI BWMA Extensions Channel (RBEC) with optional Imp. Vol. candle coloring. RBEC provides a smoothed price centerline, volatility-based inner and outer bands, and a regime display informed by smoothed RSI. Imp. Vol. colors candles by its volume-adjusted momentum reading, making bullish or bearish pressure easier to see alongside RBEC structure.
How it may be useful:
- RBEC’s centerline and bands help frame trend, pullbacks, and areas where price is stretched relative to recent volatility.
- RBEC’s dashboard summarizes regime, smoothed RSI, centerline slope, and price position within the channel.
- Imp. Vol. candles distinguish strong and weak bullish or bearish readings. Their display can be turned off and their colors customized.
- The dashboard’s Imp. Vol. percentage is a bounded momentum score derived from the live-versus-smoothed reading and smoothed-line slope. It is not a price return or probability of success. Its arrow indicates whether that score is improving, worsening, or relatively flat.
Possible way to interpret it:
In a confirmed RBEC bull or bear regime, look for price to pull back toward the centerline or inner band, then watch whether Imp. Vol. candle coloring and its dashboard arrow support a resumption of momentum. If price reaches an outer band while Imp. Vol. weakens, treat that as a reason to reassess momentum—not as a reversal signal by itself. Consider confirming with price action and your own risk rules; these are possible interpretations, not validated trading signals.
Attribution: The Imp. Vol. calculations and candle-color thresholds are adapted from AlphaExtract’s open-source Impulse Volume Oscillator. Retain the original author attribution and license notice when publishing. TradingView
AlphaExtract’s Impulse Volume Oscillator on TradingView · AlphaExtract website

Thông báo miễn trừ trách nhiệm
Thông tin và các ấn phẩm này không nhằm mục đích, và không cấu thành, lời khuyên hoặc khuyến nghị về tài chính, đầu tư, giao dịch hay các loại khác do TradingView cung cấp hoặc xác nhận. Đọc thêm tại Điều khoản Sử dụng.
Thông báo miễn trừ trách nhiệm
Thông tin và các ấn phẩm này không nhằm mục đích, và không cấu thành, lời khuyên hoặc khuyến nghị về tài chính, đầu tư, giao dịch hay các loại khác do TradingView cung cấp hoặc xác nhận. Đọc thêm tại Điều khoản Sử dụng.