Time-Slot Price-Volume Context [IEF]
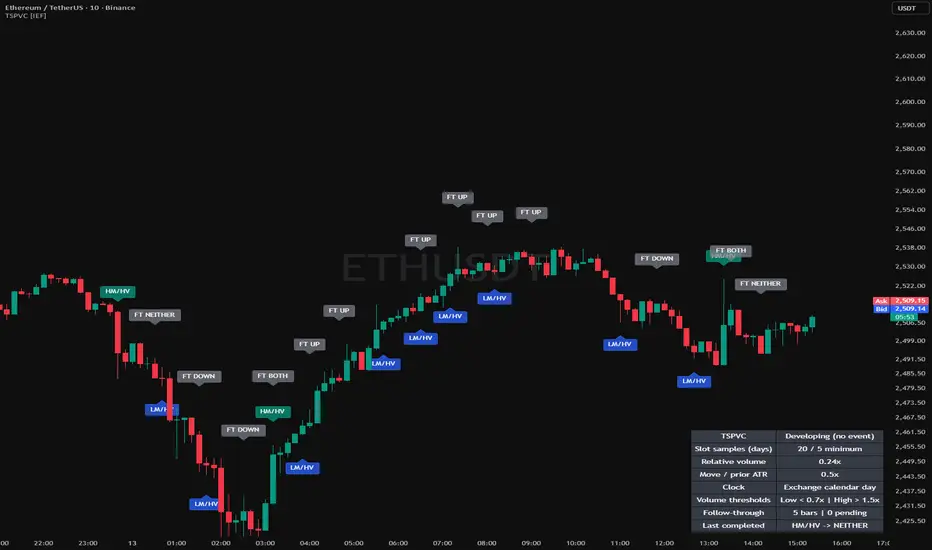
Time-Slot Price-Volume Context describes unusual bar-volume and price-movement combinations, then records which boundaries of the event candle were broken during a fixed observation window. It is an open-source chart research tool, not an entry/exit system or a performance backtest.
Prior-day time-slot baseline
The exchange clock divides each calendar day into 15-, 30-, or 60-minute slots. For each completed observed day, the script calculates the mean positive-volume bar volume in each slot. Expected volume is the equally weighted mean of those daily slot samples across the selected number of prior observed days. It does not aggregate exchange trading sessions or compare total session volume. Changing the chart timezone does not change the exchange-clock buckets.
The current day is excluded from its reference baseline. The first loaded day is discarded because it may be partial. Missing or zero-volume observations are excluded; missing slots reduce the displayed sample count. Other partially populated days can contribute available observations. A slot must have the configured minimum number of valid prior-day samples before events are classified. The current bar must also have positive volume and a valid prior ATR.
Relative volume (RV) = current bar volume / expected bar volume for its time slot.
Movement (M) = absolute close-to-close movement / previous bar's ATR.
This is close-to-close movement, not candle range or real-body size. Volume units and reliability depend on the data feed.
Event definitions
Low and high relative-volume thresholds are independently adjustable. Defaults are low below 0.7x and high above 1.5x. Values between the thresholds, including equality, are neutral. Low must be less than high. These settings are heuristics, not statistically optimized parameters.
High movement exceeds the movement threshold (default 1.5x prior ATR). Low movement is below its reciprocal (default approximately 0.67x). Equality is neither high nor low.
- HM/LV: high movement / low volume.
- LM/HV: low movement / high volume.
- HM/HV: high movement / high volume.
These names report observable conditions. They do not establish absorption, exhaustion, institutional activity, reversals, or continuation. Event labels and event alert conditions require a closed candle.
Follow-through observation
When a displayed event appears, its candle high, low, time, relative volume, movement, and sample count are frozen. Only events selected by the event-display toggles and label cooldown enter follow-through tracking. With the default cooldown of three, the next three bars after a displayed event cannot create another displayed/tracked event. Base event alerts are not suppressed by the display toggles or cooldown.
The following N closed chart bars are examined, excluding the event candle itself. N defaults to five; on a five-minute chart this is normally 25 minutes, but gaps or session closures can extend elapsed clock time. Wicks count: high strictly above the frozen high is an upper break, and low strictly below the frozen low is a lower break. Equality is only a touch.
- FT UP: upper boundary broken, lower boundary never broken in the window.
- FT DOWN: lower boundary broken, upper boundary never broken.
- FT BOTH: both boundaries broken during the window.
- FT NEITHER: neither boundary broken.
The outcome label is placed on the final observation candle only when it closes, never retrospectively on the event candle. Its tooltip identifies the original event, frozen values, and first break-bar numbers. BOTH does not infer intrabar ordering when both boundaries break in the same candle. Pending windows at the end of available data remain pending, not NEITHER. Overlapping windows are tracked independently.
Separate outcome alert conditions become true when the full observation window finishes. Turning off outcome labels does not disable tracking or outcome alerts; turning off tracking disables both. Existing TradingView alerts retain their saved script/settings snapshot, so recreate them after changes. Select Once Per Bar Close when configuring alerts. Replay chart observations do not verify delivery of live alerts.
Distinct purpose and use
This implementation links an equal-day-weighted, prior-day time-slot volume baseline to a bounded event-range observation. Unlike a rolling volume/range classifier, its reference is the same exchange-clock slot on prior observed days. Its follow-through results describe subsequent boundary breaks without converting them into wins, losses, trading probabilities, or hypothetical profits.
Use standard time-based minute candles whose interval divides the slot width. For example, Binance ETHUSDT five-minute candles work with 30-minute slots. Nonstandard charts and incompatible intervals are rejected. Configure the baseline and minimum samples first, then the descriptive thresholds and observation window. Compact labels, measurement tooltips, label size, cooldown, transparency, and dashboard corner are configurable.
Limitations and disclaimer
The script has no entries, stops, targets, execution model, costs, or profitability calculation. A boundary break can be small, temporary, or unfavorable to any particular trading method. Changing settings or the amount of loaded history recalculates the baseline and observations. Data revisions, sparse slots, missing bars, exchange-clock daylight-saving transitions, and volume-feed differences can affect results. Days are equally weighted but weekdays and weekends are pooled. Pine retains at most 500 labels, so older labels can disappear as new ones are created.
Developing-bar dashboard measurements can change; event and outcome classifications wait for closed bars. Educational and informational use only. Not financial, investment, or trading advice. No predictive accuracy, returns, or future performance is claimed.
Prior-day time-slot baseline
The exchange clock divides each calendar day into 15-, 30-, or 60-minute slots. For each completed observed day, the script calculates the mean positive-volume bar volume in each slot. Expected volume is the equally weighted mean of those daily slot samples across the selected number of prior observed days. It does not aggregate exchange trading sessions or compare total session volume. Changing the chart timezone does not change the exchange-clock buckets.
The current day is excluded from its reference baseline. The first loaded day is discarded because it may be partial. Missing or zero-volume observations are excluded; missing slots reduce the displayed sample count. Other partially populated days can contribute available observations. A slot must have the configured minimum number of valid prior-day samples before events are classified. The current bar must also have positive volume and a valid prior ATR.
Relative volume (RV) = current bar volume / expected bar volume for its time slot.
Movement (M) = absolute close-to-close movement / previous bar's ATR.
This is close-to-close movement, not candle range or real-body size. Volume units and reliability depend on the data feed.
Event definitions
Low and high relative-volume thresholds are independently adjustable. Defaults are low below 0.7x and high above 1.5x. Values between the thresholds, including equality, are neutral. Low must be less than high. These settings are heuristics, not statistically optimized parameters.
High movement exceeds the movement threshold (default 1.5x prior ATR). Low movement is below its reciprocal (default approximately 0.67x). Equality is neither high nor low.
- HM/LV: high movement / low volume.
- LM/HV: low movement / high volume.
- HM/HV: high movement / high volume.
These names report observable conditions. They do not establish absorption, exhaustion, institutional activity, reversals, or continuation. Event labels and event alert conditions require a closed candle.
Follow-through observation
When a displayed event appears, its candle high, low, time, relative volume, movement, and sample count are frozen. Only events selected by the event-display toggles and label cooldown enter follow-through tracking. With the default cooldown of three, the next three bars after a displayed event cannot create another displayed/tracked event. Base event alerts are not suppressed by the display toggles or cooldown.
The following N closed chart bars are examined, excluding the event candle itself. N defaults to five; on a five-minute chart this is normally 25 minutes, but gaps or session closures can extend elapsed clock time. Wicks count: high strictly above the frozen high is an upper break, and low strictly below the frozen low is a lower break. Equality is only a touch.
- FT UP: upper boundary broken, lower boundary never broken in the window.
- FT DOWN: lower boundary broken, upper boundary never broken.
- FT BOTH: both boundaries broken during the window.
- FT NEITHER: neither boundary broken.
The outcome label is placed on the final observation candle only when it closes, never retrospectively on the event candle. Its tooltip identifies the original event, frozen values, and first break-bar numbers. BOTH does not infer intrabar ordering when both boundaries break in the same candle. Pending windows at the end of available data remain pending, not NEITHER. Overlapping windows are tracked independently.
Separate outcome alert conditions become true when the full observation window finishes. Turning off outcome labels does not disable tracking or outcome alerts; turning off tracking disables both. Existing TradingView alerts retain their saved script/settings snapshot, so recreate them after changes. Select Once Per Bar Close when configuring alerts. Replay chart observations do not verify delivery of live alerts.
Distinct purpose and use
This implementation links an equal-day-weighted, prior-day time-slot volume baseline to a bounded event-range observation. Unlike a rolling volume/range classifier, its reference is the same exchange-clock slot on prior observed days. Its follow-through results describe subsequent boundary breaks without converting them into wins, losses, trading probabilities, or hypothetical profits.
Use standard time-based minute candles whose interval divides the slot width. For example, Binance ETHUSDT five-minute candles work with 30-minute slots. Nonstandard charts and incompatible intervals are rejected. Configure the baseline and minimum samples first, then the descriptive thresholds and observation window. Compact labels, measurement tooltips, label size, cooldown, transparency, and dashboard corner are configurable.
Limitations and disclaimer
The script has no entries, stops, targets, execution model, costs, or profitability calculation. A boundary break can be small, temporary, or unfavorable to any particular trading method. Changing settings or the amount of loaded history recalculates the baseline and observations. Data revisions, sparse slots, missing bars, exchange-clock daylight-saving transitions, and volume-feed differences can affect results. Days are equally weighted but weekdays and weekends are pooled. Pine retains at most 500 labels, so older labels can disappear as new ones are created.
Developing-bar dashboard measurements can change; event and outcome classifications wait for closed bars. Educational and informational use only. Not financial, investment, or trading advice. No predictive accuracy, returns, or future performance is claimed.

— IndicatorEliteFlow
No hype. Just data.
No hype. Just data.
Thông báo miễn trừ trách nhiệm
Thông tin và các ấn phẩm này không nhằm mục đích, và không cấu thành, lời khuyên hoặc khuyến nghị về tài chính, đầu tư, giao dịch hay các loại khác do TradingView cung cấp hoặc xác nhận. Đọc thêm tại Điều khoản Sử dụng.
— IndicatorEliteFlow
No hype. Just data.
No hype. Just data.
Thông báo miễn trừ trách nhiệm
Thông tin và các ấn phẩm này không nhằm mục đích, và không cấu thành, lời khuyên hoặc khuyến nghị về tài chính, đầu tư, giao dịch hay các loại khác do TradingView cung cấp hoặc xác nhận. Đọc thêm tại Điều khoản Sử dụng.