OPEN-SOURCE SCRIPT
Vaultfy Sentiment Apex
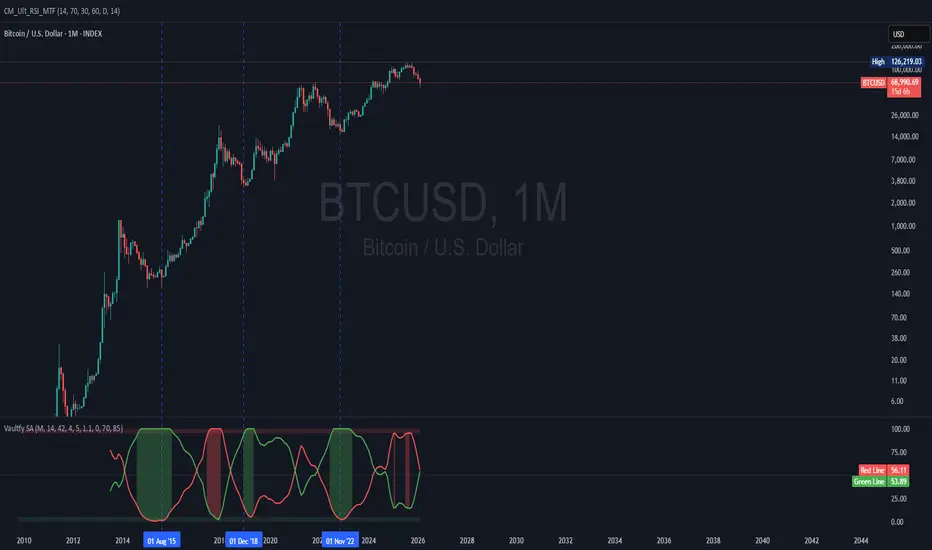
Vaultfy Sentiment Apex is a high-precision sentiment oscillator designed to identify market exhaustion zones and trend reversals through a normalized dual-line approach.
By analyzing RSI data across customizable timeframes and applying advanced normalization, this indicator tracks the "tug-of-war" between bullish and bearish sentiment, providing clear visual cues when the market reaches overextended levels.
How it works:
The indicator plots two contrasting sentiment lines:
Red Line: Represents the primary sentiment momentum.
Green Line: Represents the counter-sentiment momentum.
Unlike standard oscillators, Vaultfy Sentiment Apex uses a dynamic normalization window to ensure that the 0-100 scale remains relevant to recent historical price action, rather than static overbought/oversold levels.
Key Features:
Exhaustion Zones (95 & 5): The indicator features static "Warning Zones" at the top (Red, 95-100) and bottom (Green, 0-5). These represent extreme exhaustion.
Dynamic Extreme Fill: To keep your chart clean, the area between the lines only highlights when one of the sentiment lines penetrates the 95 or 5 levels. This instantly alerts you to high-probability reversal or cooling-off zones.
Multi-Timeframe Engine: Built-in MTF capability allows you to track Monthly or Weekly sentiment while trading on lower timeframes.
Customizable Smoothing: Dual EMA smoothing (RSI and Final) allows you to filter out market noise and focus on the core trend.
Usage Tips:
Sentiment Extremes: When the dynamic fill appears in the Top Red Zone, the market is heavily overextended to one side—watch for a potential top or consolidation.
Sentiment Extremes: Conversely, a fill in the Bottom Green Zone suggests the sentiment has hit a floor, often preceding a bounce or trend shift.
Crossovers: Watch for the Green and Red lines crossing as early signals of momentum shifts within the neutral 5-95 range.
By analyzing RSI data across customizable timeframes and applying advanced normalization, this indicator tracks the "tug-of-war" between bullish and bearish sentiment, providing clear visual cues when the market reaches overextended levels.
How it works:
The indicator plots two contrasting sentiment lines:
Red Line: Represents the primary sentiment momentum.
Green Line: Represents the counter-sentiment momentum.
Unlike standard oscillators, Vaultfy Sentiment Apex uses a dynamic normalization window to ensure that the 0-100 scale remains relevant to recent historical price action, rather than static overbought/oversold levels.
Key Features:
Exhaustion Zones (95 & 5): The indicator features static "Warning Zones" at the top (Red, 95-100) and bottom (Green, 0-5). These represent extreme exhaustion.
Dynamic Extreme Fill: To keep your chart clean, the area between the lines only highlights when one of the sentiment lines penetrates the 95 or 5 levels. This instantly alerts you to high-probability reversal or cooling-off zones.
Multi-Timeframe Engine: Built-in MTF capability allows you to track Monthly or Weekly sentiment while trading on lower timeframes.
Customizable Smoothing: Dual EMA smoothing (RSI and Final) allows you to filter out market noise and focus on the core trend.
Usage Tips:
Sentiment Extremes: When the dynamic fill appears in the Top Red Zone, the market is heavily overextended to one side—watch for a potential top or consolidation.
Sentiment Extremes: Conversely, a fill in the Bottom Green Zone suggests the sentiment has hit a floor, often preceding a bounce or trend shift.
Crossovers: Watch for the Green and Red lines crossing as early signals of momentum shifts within the neutral 5-95 range.
Mã nguồn mở
Theo đúng tinh thần TradingView, tác giả của tập lệnh này đã công bố nó dưới dạng mã nguồn mở, để các nhà giao dịch có thể xem xét và xác minh chức năng. Chúc mừng tác giả! Mặc dù bạn có thể sử dụng miễn phí, hãy nhớ rằng việc công bố lại mã phải tuân theo Nội quy.

Thông báo miễn trừ trách nhiệm
Thông tin và các ấn phẩm này không nhằm mục đích, và không cấu thành, lời khuyên hoặc khuyến nghị về tài chính, đầu tư, giao dịch hay các loại khác do TradingView cung cấp hoặc xác nhận. Đọc thêm tại Điều khoản Sử dụng.
Mã nguồn mở
Theo đúng tinh thần TradingView, tác giả của tập lệnh này đã công bố nó dưới dạng mã nguồn mở, để các nhà giao dịch có thể xem xét và xác minh chức năng. Chúc mừng tác giả! Mặc dù bạn có thể sử dụng miễn phí, hãy nhớ rằng việc công bố lại mã phải tuân theo Nội quy.
Thông báo miễn trừ trách nhiệm
Thông tin và các ấn phẩm này không nhằm mục đích, và không cấu thành, lời khuyên hoặc khuyến nghị về tài chính, đầu tư, giao dịch hay các loại khác do TradingView cung cấp hoặc xác nhận. Đọc thêm tại Điều khoản Sử dụng.