OPEN-SOURCE SCRIPT
Cập nhật Dual Iron Butterfly Analyzer
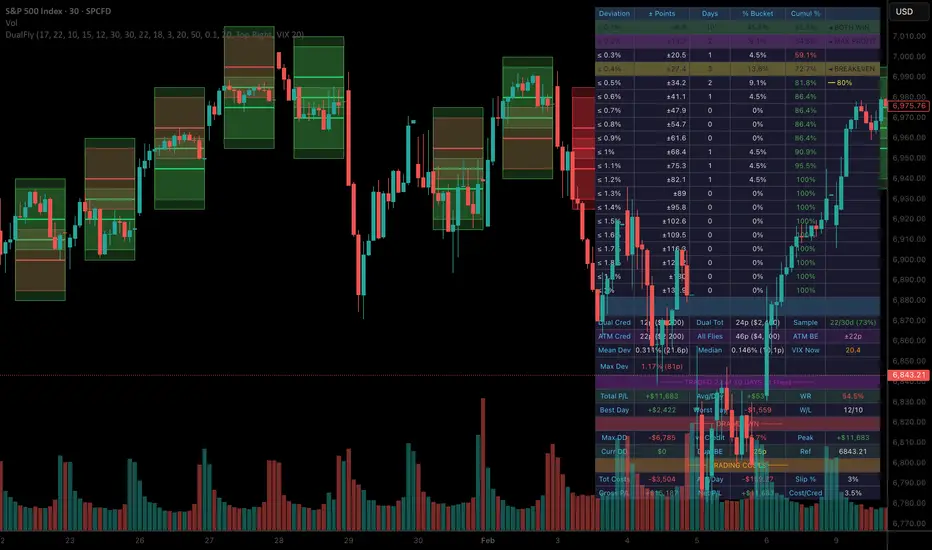
Overview
This indicator backtests and analyzes a 0DTE (zero days to expiration) dual iron butterfly options strategy on SPX. It measures how often price stays within profitable ranges from a fixed daily entry time to settlement, calculating expected P/L based on your butterfly structure.
The strategy enters at 16:00 CET (10:00 ET) and settles at RTH close (22:00 CET / 16:00 ET), giving approximately 6 hours of exposure per trade.
Strategy Structure
The dual iron butterfly consists of two overlapping flies centered around the entry price:
Fly A (Bearish-Biased)
Center strike at Entry Price minus Offset (default: -20 points)
Wings extend ±40 points from center
Fly B (Bullish-Biased)
Center strike at Entry Price plus Offset (default: +20 points)
Wings extend ±40 points from center
This creates three profit zones:
How It Works
The indicator captures the entry price at 16:00 CET each trading day and records the settlement price at the following day's first bar. It then calculates:
Deviation Analysis
Absolute percentage and point deviation from entry to settlement, sorted into customizable buckets to show the probability distribution.
P/L Calculation
For each fly, the P/L formula is: Credit minus the minimum of (deviation from center) or (wing width). The combined P/L sums both flies. With default settings (29 points credit per fly, $100 multiplier), max profit per day is $3,200 and max loss is $2,200.
Drawdown Tracking
The indicator tracks cumulative P/L over the lookback period, calculating peak equity, maximum drawdown, and current drawdown to assess strategy risk.
What Makes This Different
Unlike standard deviation indicators, this tool is purpose-built for options traders analyzing dual iron butterfly viability. It provides:
Features
Settings Guide
Iron Butterfly Structure
Distribution Settings
Display
How to Use
Interpreting the Table
Chart Requirements
Alerts
Limitations
Disclaimer
This indicator is for educational and research purposes only. It does not constitute financial advice.
This indicator backtests and analyzes a 0DTE (zero days to expiration) dual iron butterfly options strategy on SPX. It measures how often price stays within profitable ranges from a fixed daily entry time to settlement, calculating expected P/L based on your butterfly structure.
The strategy enters at 16:00 CET (10:00 ET) and settles at RTH close (22:00 CET / 16:00 ET), giving approximately 6 hours of exposure per trade.
Strategy Structure
The dual iron butterfly consists of two overlapping flies centered around the entry price:
Fly A (Bearish-Biased)
Center strike at Entry Price minus Offset (default: -20 points)
Wings extend ±40 points from center
Fly B (Bullish-Biased)
Center strike at Entry Price plus Offset (default: +20 points)
Wings extend ±40 points from center
This creates three profit zones:
- Max Profit Zone: Price settles between the two center strikes (within ±20 points of entry)
- Both Win Zone: Price settles where both flies remain profitable (within ±40 points)
- Breakeven Zone: Combined structure breaks even at ±60 points from entry
How It Works
The indicator captures the entry price at 16:00 CET each trading day and records the settlement price at the following day's first bar. It then calculates:
Deviation Analysis
Absolute percentage and point deviation from entry to settlement, sorted into customizable buckets to show the probability distribution.
P/L Calculation
For each fly, the P/L formula is: Credit minus the minimum of (deviation from center) or (wing width). The combined P/L sums both flies. With default settings (29 points credit per fly, $100 multiplier), max profit per day is $3,200 and max loss is $2,200.
Drawdown Tracking
The indicator tracks cumulative P/L over the lookback period, calculating peak equity, maximum drawdown, and current drawdown to assess strategy risk.
What Makes This Different
Unlike standard deviation indicators, this tool is purpose-built for options traders analyzing dual iron butterfly viability. It provides:
- Options-specific P/L calculations based on actual butterfly payoff structure
- Visual probability distribution with key thresholds marked (breakeven, both-win, max-profit zones)
- Rolling lookback window that respects your chosen sample size
- Drawdown metrics essential for position sizing and risk management
Features
- Distribution Table — Shows deviation buckets with cumulative probability
- Zone Highlighting — Color-coded rows for max profit, both-win, and breakeven thresholds
- P/L Summary — Total P/L, average per session, win rate, best/worst days
- Drawdown Section — Max drawdown in dollars and percentage, peak equity, current drawdown
- Optional Labels — Entry and settlement markers on the chart
- Configurable Structure — Adjust offset, wing width, and credit to match your actual trades
Settings Guide
Iron Butterfly Structure
- [code]Center Offset[/code] — Distance from entry price to each fly's center strike (default: 20 points). Larger offset = wider max profit zone but lower probability.
- [code]Wing Width[/code] — Distance from center to outer wings (default: 40 points). Determines max loss per fly and breakeven distance.
- [code]Net Credit per Fly[/code] — Premium received per iron butterfly in SPX points (default: 29). Adjust based on current market conditions and your actual fills.
- [code]Lookback[/code] — Rolling window of trading days to analyze (default: 252 = 1 year). Use 504 for 2 years of data.
Distribution Settings
- [code]Bucket Size[/code] — Percentage increment for distribution buckets (default: 0.10%). Smaller = more granular view.
- [code]Number of Buckets[/code] — How many rows to display (default: 20).
Display
- [code]Table Position[/code] — Corner placement for the statistics table.
- [code]Show Entry/Settle Labels[/code] — Toggle chart labels marking entry and settlement prices.
How to Use
- Apply to SPX (SPCFD) on an intraday timeframe (1 hour recommended)
- Set the butterfly parameters to match your intended trade structure
- Review the Cumul % column to see probability of staying within each deviation level
- The highlighted BREAKEVEN row shows your probability of profit
- Use the P/L Summary to evaluate expected returns over your lookback period
- Monitor the Drawdown section to understand worst-case scenarios for position sizing
Interpreting the Table
- Purple row (MAX PROFIT) — Deviation where both flies achieve maximum profit
- Green row (BOTH WIN) — Deviation where both flies remain profitable
- Yellow row (BREAKEVEN) — Combined structure breakeven point
- Green percentages (≥80%) — High probability levels
- Orange percentages (60-79%) — Medium probability levels
- Red percentages (<60%) — Lower probability levels
Chart Requirements
- Symbol: SPX (use SPCFD for extended hours data)
- Timeframe: Intraday (1h recommended, 30m or lower also works)
- The chart must include 16:00 CET bars for entry detection
Alerts
- Deviation Exceeds Breakevens — Triggered when settlement exceeds the combined breakeven range
- Max Profit Zone Hit — Triggered when settlement falls within the max profit zone
Limitations
- Historical analysis only — Past deviation patterns may not predict future behavior
- Fixed entry time — Does not account for intraday entry timing optimization
- Credit assumption — Actual premiums vary with VIX, time to expiry, and market conditions
- No transaction costs — Does not include commissions, fees, or slippage
- Single contract — Assumes 1 contract per trade with no scaling or compounding
Disclaimer
This indicator is for educational and research purposes only. It does not constitute financial advice.
- Past performance does not guarantee future results
- Options trading involves significant risk of loss
- The P/L calculations are theoretical based on your input parameters
- Always paper trade and validate with real market data before risking capital
- Conduct your own research and consult a financial advisor if needed
Phát hành các Ghi chú
OverviewThis indicator backtests a 0DTE dual iron butterfly options strategy on SPX. It measures how often price stays within profitable ranges from entry to settlement, calculating expected P/L based on your butterfly structure — now with VIX-based filtering to identify optimal trading conditions.
Entry: 16:00 CET (10:00 ET) — Settlement: RTH close (22:00 CET / 16:00 ET)
What's New in v1.8.0
- VIX Filter — Skip entries when VIX exceeds your threshold
- VIX Analysis — Performance breakdown by VIX bucket (< 15, 15-20, 20-25, > 25)
- Filter Comparison — See projected P/L and drawdown with vs without filtering
- Optional Third Fly — ATM iron butterfly for additional premium
- Visual Fly Zones — Boxes on chart showing profit/loss areas
Strategy Structure
Two offset iron butterflies centered around entry price:
- Fly A: Center = Entry − Offset, Wings ±Width
- Fly B: Center = Entry + Offset, Wings ±Width
- Fly C (Optional): ATM at Entry, Wings ±Width
Profit zones with default settings (10pt offset, 30pt wings):
- Max Profit: ±10 points (all flies win max)
- Both Win: ±20 points (offset flies profitable)
- Breakeven: ±40 points (combined P/L = $0)
VIX Filter — Key Feature
High VIX often means larger intraday moves that breach breakeven levels. The VIX analysis shows win rate and average P/L for each volatility regime, helping you identify when to sit out.
Usage:
- Keep filter OFF first — review VIX Analysis section
- Identify where performance turns negative (typically VIX > 20)
- Set threshold and enable filter
- Compare DD Δ (drawdown change) and P/L Δ (profit change)
Settings Guide
Iron Butterfly Structure
- [code]Center Offset[/code] — Distance to each fly's center (default: 10 pts)
- [code]Wing Width[/code] — Distance to outer strikes (default: 30 pts)
- [code]Net Credit per Fly[/code] — Premium received per fly (default: 20 pts)
- [code]Lookback[/code] — Trading days to analyze (252 = 1 year)
Third Fly — ATM (Optional)
- [code]Enable Third Fly[/code] — Adds ATM iron butterfly
- [code]Wing Width / Credit[/code] — Can differ from offset flies
VIX Filter
- [code]Enable VIX Filter[/code] — Skip entries when VIX > threshold
- [code]Max VIX for Entry[/code] — Threshold level (default: 20)
- [code]Show VIX Analysis[/code] — Display performance by VIX bucket
Table Sections
- Distribution — Deviation buckets with cumulative probability
- Zone Markers — MAX PROFIT (purple), BOTH WIN (green), BREAKEVEN (yellow)
- P/L Summary — Total, average, win rate, best/worst day
- Drawdown — Max DD, peak equity, current DD
- VIX Analysis — Performance by VIX range + filter comparison
Chart Setup
- Symbol: SPX on intraday timeframe (30m or 1h recommended)
- Enable "Show Fly Zone Boxes" to visualize profit/loss areas
- Green boxes = profitable fly, Red boxes = losing fly
Limitations
- Historical analysis only — past performance ≠ future results
- Does not include transaction costs, slippage, or bid-ask spreads
- Credit assumptions may differ from actual market prices
- VIX at entry may not reflect full session volatility
Disclaimer
For educational purposes only. Not financial advice. Options trading involves substantial risk. Always paper trade first and never risk more than you can afford to lose.
Phát hành các Ghi chú
v1.8.8 UpdateMulti-Configuration Support
New "Config Name" input in Webhook settings lets you run multiple indicator instances with different parameters in parallel. Each configuration sends its unique name in webhook payloads, so your server can track and compare strategies separately (e.g., "conservative", "ema_aggressive", "high_vix").
Full Config in All Webhooks
Every webhook event (OPEN, SETTLED, SKIPPED) now includes a complete config snapshot with all indicator settings: offset, wing widths, credits, VIX filter, and EMA filter parameters. No more guessing which settings generated a trade.
Pre-Calculated P/L
SETTLED events now include [code]pl_pts[/code] and [code]pl_dollars[/code] fields calculated by the indicator, simplifying server-side processing.
EMA Direction Field
New [code]ema_direction[/code] field in payloads shows trend at entry: "bullish", "bearish", or "none" (filter disabled).
v1.8.7 Recap
EMA Directional Filter
Trade with the trend. When enabled:
- EMA20 > EMA50 (bullish): Opens Upper Fly (B) + ATM only
- EMA20 < EMA50 (bearish): Opens Lower Fly (A) + ATM only
Reduces exposure from 3 to 2 flies, avoiding the counter-trend fly that often causes losses.
Webhook Payload Example (SETTLED)
[code]
{
"config_name": "ema_trend_vix20",
"status": "settled",
"fly_type": "FLY_B",
"pl_pts": 13.5,
"pl_dollars": 1350,
"ema_direction": "bullish",
"config": {
"offset": 10,
"wing_width": 30,
"vix_filter_enabled": true,
"vix_max": 20,
"ema_filter_enabled": true,
"ema_fast": 20,
"ema_slow": 50
}
}
[/code]
Phát hành các Ghi chú
v1.9.1 - Accurate Sample TrackingWhat's Fixed:
- Sample now shows all trading days - Display changed from "252d" to "180/252d (71%)" showing traded vs total days
- Statistics accuracy - W/L, Win Rate, Avg P/L now based only on actually traded days (skipped days excluded)
- VIX what-if analysis - "IF VIX ≤ X" section shows hypothetical results for different thresholds
- Deviation distribution - Bucket percentages based on traded days only
Why This Matters:
Previously only stored days where trades executed. With VIX filter at 16, if you traded 180 of 252 days, it showed "252/252d" because skipped days weren't tracked. Now correctly shows "180/252d (71%)" - true insight into filter selectivity.
Also includes from v1.9.0:
- Alert timing: Fires at bar OPEN (16:00) not CLOSE (16:30)
- Sequential fly numbering: Webhooks use 1, 2, 3 based on opened flies
Phát hành các Ghi chú
New in v1.9.2:Early close day fix - Settlement now triggers correctly on days when market closes early (MLK, half-days, DST shifts)
Fallback mechanism - If 22:00 bar is missed, settles at next day open using previous day's last close
Blue boxes fixed - Historical trades that missed settlement now properly recolor to green/red
Phát hành các Ghi chú
v1.9.4 - Trading Costs + Early Close FixWhat's New:
1. Trading Costs Calculation
Now includes realistic costs in all P/L calculations:
- Commission - Fixed $7.09 per fly opened (industry standard for SPX options)
- Slippage - Adjustable % of credit received (default 3%)
- Net P/L - All statistics now reflect actual take-home after costs
Example (20pt credit, 3% slippage, 2 flies):
Commission: $7.09 × 2 = $14.18
Slippage: 20 × 0.03 × $100 × 2 = $120
Total Cost/Day: $134.18
2. New Table Section: TRADING COSTS
- Tot Costs - Cumulative commission + slippage over lookback period
- Avg/Day - Average cost per traded day
- Gross P/L - Market outcome before costs
- Net P/L - Actual result after costs
- Cost/Cred - Total costs as % of credit deployed
3. Early Close Day Fix
Settlement now triggers correctly on:
- MLK Day (market closes 19:00 CET)
- Half-days (Thanksgiving eve, Christmas eve, etc.)
- DST transition days
- Any day where 22:00 CET bar doesn't exist
Previously, trades on early close days remained "blue" (unsettled) and weren't included in statistics. Now they settle automatically at next session open using the previous day's last close price.
4. Settings
New input under "Trading Costs" group:
- Slippage (%) - Default 3%, adjustable 0-20%
Commission is fixed at $7.09/fly (no input needed).
Why This Matters:
Realistic cost modeling is essential for accurate backtesting. A strategy showing +$50,000 gross profit might only net +$35,000 after costs. This update ensures the numbers you see reflect what you'd actually keep.
Technical Notes:
- Costs are calculated per fly opened (not per trade)
- EMA directional filter reduces costs on filtered days (1 fly vs 2)
- ATM fly adds its own commission + slippage when enabled
- No closing costs since 0DTE options expire worthless or ITM
Phát hành các Ghi chú
v1.9.4: Settlement fix - missedSettlement no longer blocks same-day 22:00 closeThe core fix resets settlementDoneToday := false after a new entry opens, so that a missed settlement from a prior day no longer poisons the flag and blocks the current day's 22:00 close. The sessionEndedGap detection was also added as a safety net for early-close days.
Phát hành các Ghi chú
v1.9.5: Settled alerts use core var variables — survive indicator reloadsPhát hành các Ghi chú
v1.9.6: Remove isRealtimeBar guard from settlement alerts — fixes missed settlements on 30m chart where 22:00 CET bar doesn't exist (market closes at 21:30 CET bar)Mã nguồn mở
Theo đúng tinh thần TradingView, tác giả của tập lệnh này đã công bố nó dưới dạng mã nguồn mở, để các nhà giao dịch có thể xem xét và xác minh chức năng. Chúc mừng tác giả! Mặc dù bạn có thể sử dụng miễn phí, hãy nhớ rằng việc công bố lại mã phải tuân theo Nội quy.

Thông báo miễn trừ trách nhiệm
Thông tin và các ấn phẩm này không nhằm mục đích, và không cấu thành, lời khuyên hoặc khuyến nghị về tài chính, đầu tư, giao dịch hay các loại khác do TradingView cung cấp hoặc xác nhận. Đọc thêm tại Điều khoản Sử dụng.
Mã nguồn mở
Theo đúng tinh thần TradingView, tác giả của tập lệnh này đã công bố nó dưới dạng mã nguồn mở, để các nhà giao dịch có thể xem xét và xác minh chức năng. Chúc mừng tác giả! Mặc dù bạn có thể sử dụng miễn phí, hãy nhớ rằng việc công bố lại mã phải tuân theo Nội quy.
Thông báo miễn trừ trách nhiệm
Thông tin và các ấn phẩm này không nhằm mục đích, và không cấu thành, lời khuyên hoặc khuyến nghị về tài chính, đầu tư, giao dịch hay các loại khác do TradingView cung cấp hoặc xác nhận. Đọc thêm tại Điều khoản Sử dụng.