Cập nhật
GEX Flow + Absorption + FVG + ORB + MAs + Signals
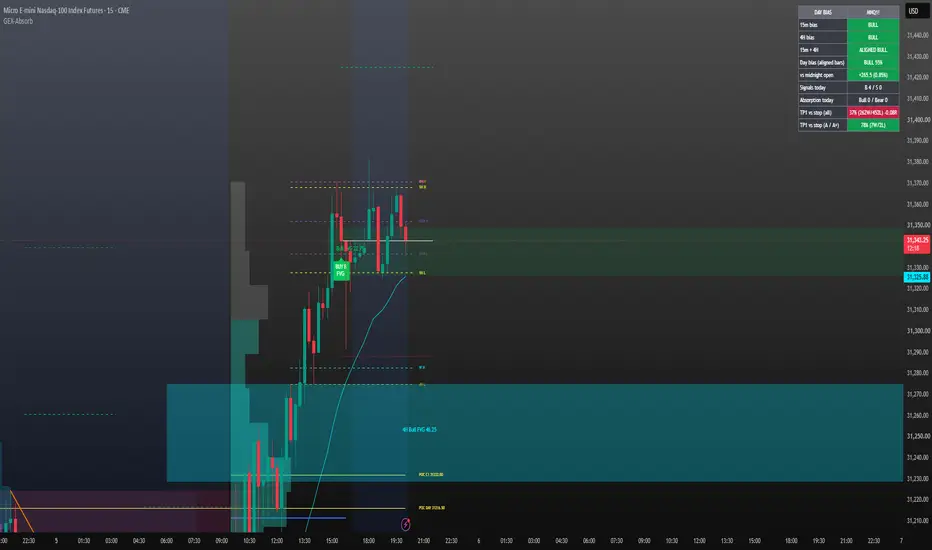
GEX-Absorb: indicator summary
It's a Pine Script v6 overlay for TradingView, built around NQ-style order flow and market structure. I haven't compiled it yet, so expect small fixes on first paste.
Absorption bubbles
A bubble appears on a bar with unusually high volume (2x the 50-bar average by default) and a strong one-sided delta.
Green means sellers hit hard but price held the upper half, so buyers absorbed. Red is the reverse.
Each bubble shows the bar's volume, and larger volume gives a larger bubble.
Delta is approximated from lower-timeframe candles, because TradingView has no real bid/ask footprint data.
Fair value gaps
It marks bullish and bearish gaps of at least 8 points, with labels like "Bull FVG 12.5".
Gaps extend to the right and stop when price closes through them.
9:30 ORB
It draws a box plus high and low lines for the 9:30 to 9:45 New York window, extended through the session.
HTF levels
Small labeled lines mark the previous completed high and low for 1H, 4H, Daily and Weekly.
GEX levels
Call wall, put wall, and gamma flip are typed in by hand, since TradingView can't pull GEX. You'd paste them in from FlashAlpha.
Moving averages
There are four MAs (9, 21, 50, 200), with 9 off by default. Each has its own length, color, and width.
One setting switches them all between EMA, SMA, WMA, RMA, and HMA.
Buy/sell signals
Three triggers:
Price wicks the signal MA (the 200 by default) and closes back on the trade side.
Price retests an active FVG, first retest only by default.
An absorption bubble prints.
BUY and SELL labels show which triggers fired, for example "BUY MA FVG".
Controls:
Minimum number of triggers that must agree (1 by default, 2 for confluence).
An MA slope filter.
A cooldown between signals.
Alert conditions.
Customization
Every element has its own color setting, and the line styles are adjustable.
Main limits
There are no real footprint numbers or stacked imbalance labels like the ATAS screenshot has.
GEX levels are manual.
The signals are untested, so replay them before trading.
It's a Pine Script v6 overlay for TradingView, built around NQ-style order flow and market structure. I haven't compiled it yet, so expect small fixes on first paste.
Absorption bubbles
A bubble appears on a bar with unusually high volume (2x the 50-bar average by default) and a strong one-sided delta.
Green means sellers hit hard but price held the upper half, so buyers absorbed. Red is the reverse.
Each bubble shows the bar's volume, and larger volume gives a larger bubble.
Delta is approximated from lower-timeframe candles, because TradingView has no real bid/ask footprint data.
Fair value gaps
It marks bullish and bearish gaps of at least 8 points, with labels like "Bull FVG 12.5".
Gaps extend to the right and stop when price closes through them.
9:30 ORB
It draws a box plus high and low lines for the 9:30 to 9:45 New York window, extended through the session.
HTF levels
Small labeled lines mark the previous completed high and low for 1H, 4H, Daily and Weekly.
GEX levels
Call wall, put wall, and gamma flip are typed in by hand, since TradingView can't pull GEX. You'd paste them in from FlashAlpha.
Moving averages
There are four MAs (9, 21, 50, 200), with 9 off by default. Each has its own length, color, and width.
One setting switches them all between EMA, SMA, WMA, RMA, and HMA.
Buy/sell signals
Three triggers:
Price wicks the signal MA (the 200 by default) and closes back on the trade side.
Price retests an active FVG, first retest only by default.
An absorption bubble prints.
BUY and SELL labels show which triggers fired, for example "BUY MA FVG".
Controls:
Minimum number of triggers that must agree (1 by default, 2 for confluence).
An MA slope filter.
A cooldown between signals.
Alert conditions.
Customization
Every element has its own color setting, and the line styles are adjustable.
Main limits
There are no real footprint numbers or stacked imbalance labels like the ATAS screenshot has.
GEX levels are manual.
The signals are untested, so replay them before trading.
Phát hành các Ghi chú
Summary of the latest changesThese are the changes to the volume profile since the last big update. I haven't compiled the script, so expect small fixes on first paste.
Volume profile rebuild
The old 4H-only profile is now one engine that runs five independent profiles: timeframe blocks, daily, and three custom time windows.
Timeframe blocks: the timeframe defaults to Auto, which picks 1H blocks on charts up to 3m, 4H up to 15m, Daily up to 1H, and Weekly above that. You can also fix it at 15m, 30m, 1H, 2H, 4H, Daily or Weekly. You set how many profiles to keep (up to 8), the width, and the color.
Daily profiles: these have their own count (up to 5), width and color. You can anchor the day to the chart's daily candle or to midnight New York.
Custom windows: three windows, each with its own on/off toggle, time range in New York time, and color. The defaults are 9:30 to 16:00, 02:00 to 05:00 and 20:00 to 00:00, all off. Each builds its profile when the window closes.
Shared settings:
Price bins (8 to 24, default 20).
Value area % (default 70).
Draw bars from the left or right edge of the block.
Optional VAH/VAL lines.
A color for bars outside the value area.
POC levels
Every finished profile now gets a labeled POC with its price, like "POC 4H" or "POC DAY". The custom windows are labeled "POC C1" to "POC C3".
A behavior setting controls how far the line runs:
Block only keeps it inside its profile.
Extend until touched runs it right until price trades through it. This is the default, so untouched POCs stay on the chart.
Extend always keeps it running to the current bar.
POC color, width, and the line and label toggles are in the shared settings.
Limits to know about
TradingView caps a script at 500 boxes, and each profile uses one box per bin. With everything on, the oldest profiles will start disappearing, so lower the bins or profiles kept if that happens.
Profiles are built from the bars inside each block, so they work best on a 15m chart or lower.
Stacked POC labels at the right edge can get crowded. Fewer profiles kept or labels off fixes that.
Phát hành các Ghi chú
I upgraded the signal engine, since that's where the indicator gains the most, and tightened how everything else evaluates. I haven't compiled this version either, so paste it in and send me any errors.Graded signals
Every BUY and SELL now carries a grade from C up to A+, shown in the label, for example "BUY A+ / MA HTF ABS".
The grade counts the triggers that fired, plus one if price is on the right side of VWAP, plus one if the 15m and 4H bias match the trade. A+ is 5 or more, A is 4, B is 3.
A new "Minimum grade to show" setting lets you hide everything below, say, an A.
A fourth trigger now exists: price retesting one of the HTF FVGs. It's on by default.
Filters
You can require price to be on the right side of VWAP.
You can require the 15m and 4H bias to be aligned with the trade.
You can limit signals to a New York time window.
All three are off by default, so nothing changes until you turn them on.
Risk levels
Each signal draws an entry line, a stop (1.5x ATR by default), and two targets (1.5R and 3R).
ATR length, stop distance, R multiples, line length, and how many signals keep their levels on the chart are all adjustable.
Signal stats in the table
The script follows each signal until target 1 or the stop is hit. The table shows the win rate, W/L count and average R, once for all signals and once for A and A+ only.
This is a quick sanity check, not a real backtest. It has no fees or slippage, and if the stop and target sit in the same bar it counts a loss. The numbers cover only the history your chart has loaded.
Robustness
FVG retests, HTF FVG retests, and gap-fill logic now run only on closed bars, so signals no longer flicker while a candle is forming.
Alerts now send a message with the grade, entry, stop, and target 1. To use them, create a TradingView alert on this indicator and choose "Any alert() function call".

Thông báo miễn trừ trách nhiệm
Thông tin và các ấn phẩm này không nhằm mục đích, và không cấu thành, lời khuyên hoặc khuyến nghị về tài chính, đầu tư, giao dịch hay các loại khác do TradingView cung cấp hoặc xác nhận. Đọc thêm tại Điều khoản Sử dụng.
Thông báo miễn trừ trách nhiệm
Thông tin và các ấn phẩm này không nhằm mục đích, và không cấu thành, lời khuyên hoặc khuyến nghị về tài chính, đầu tư, giao dịch hay các loại khác do TradingView cung cấp hoặc xác nhận. Đọc thêm tại Điều khoản Sử dụng.