Cập nhật
ETF Rotation - Momentum / Volatility
ETF Rotation – Momentum / Volatility (PEA-friendly)
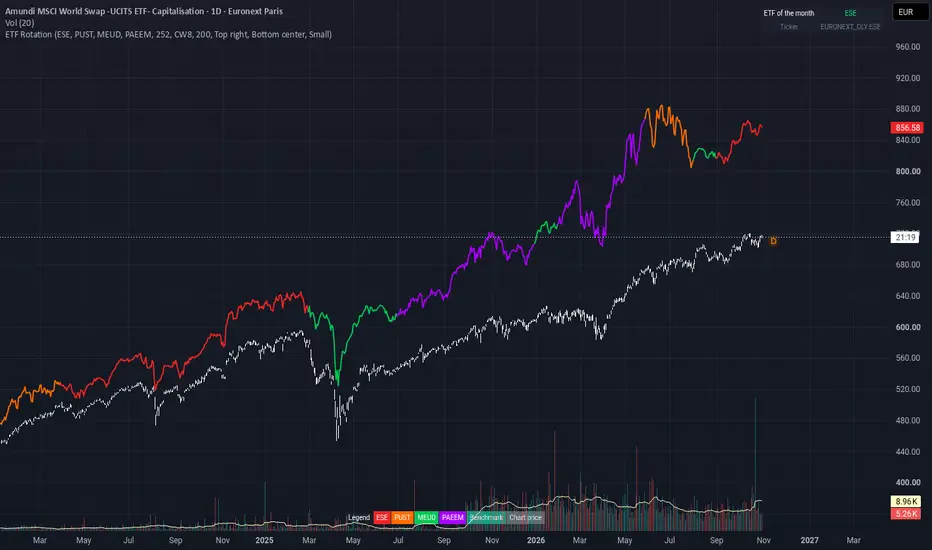
A simple monthly rotation between a small universe of ETFs. Each month, the indicator picks the ETF with the best risk-adjusted momentum and shows it in a table, together with a hypothetical equity curve you can compare with a world ETF.
It is a variant of the dual momentum idea: look for the ETF with the strongest momentum and hold only that one. I designed it with the French PEA in mind, so that anyone can follow a simple rule-based strategy for their account, but it works with any ETFs available on TradingView.
> This is a systematic framework for study. It does not guarantee results. Backtests are hypothetical and ignore fees, spreads and taxes.
How it works
- Composite momentum: average of the 1, 3, 6 and 12-month returns of each ETF.
- Volatility: annualised standard deviation of daily returns over 252 days (adjustable).
- Score = momentum / volatility. The ETF with the highest score is selected for the month.
- Rotation happens once a month, at the first trading day. 100% of the capital is in the selected ETF. No leverage and no cash position. By default there is no filter: the best-scored ETF is held even if its score is negative.
Default ETF universe (Euronext Paris, PEA-eligible)
- ESE – S&P 500 (United States)
- PUST – Nasdaq-100 (United States, growth)
- MEUD – STOXX Europe 600 (Europe)
- PAEEM – MSCI Emerging Markets
You can replace each of the 4 ETFs in the settings.
Optional regime filter (off by default)
- If you enable it, the indicator checks the benchmark ETF (default CW8, MSCI World) at each monthly rotation. If the benchmark closes below its 200-day simple moving average, the strategy holds the benchmark instead of the best-scored ETF.
- Benchmark and moving average length are adjustable. With the filter off, the behaviour is the pure rotation described above.
How to read it
- Table (top right by default): ETF of the month and its ticker. If the name and the colour of the curve change, it is a rotation signal. If not, nothing to do.
- Equity curve: compounded from the first bar, then rescaled to match the chart price on the anchor date (default 10 June 2019). Load the indicator on a world ETF such as CW8 (MSCI World) on the Daily timeframe to compare the strategy with a buy-and-hold on the same dates.
- Legend table: one colour per ETF.
Settings
- The 4 ETFs, the volatility lookback, the anchor date, the optional regime filter (on/off, benchmark, MA length), and the position and size of the tables.
Important notes
- Works on the Daily timeframe only (the script displays a message otherwise).
- The universe is small and fixed on purpose: fewer rules, fewer parameters to over-optimise.
- Real life differs from a backtest: brokerage fees, spreads, execution at the monthly close and ETF eligibility can change over time.
- This script is educational and is not financial advice.
A simple monthly rotation between a small universe of ETFs. Each month, the indicator picks the ETF with the best risk-adjusted momentum and shows it in a table, together with a hypothetical equity curve you can compare with a world ETF.
It is a variant of the dual momentum idea: look for the ETF with the strongest momentum and hold only that one. I designed it with the French PEA in mind, so that anyone can follow a simple rule-based strategy for their account, but it works with any ETFs available on TradingView.
> This is a systematic framework for study. It does not guarantee results. Backtests are hypothetical and ignore fees, spreads and taxes.
How it works
- Composite momentum: average of the 1, 3, 6 and 12-month returns of each ETF.
- Volatility: annualised standard deviation of daily returns over 252 days (adjustable).
- Score = momentum / volatility. The ETF with the highest score is selected for the month.
- Rotation happens once a month, at the first trading day. 100% of the capital is in the selected ETF. No leverage and no cash position. By default there is no filter: the best-scored ETF is held even if its score is negative.
Default ETF universe (Euronext Paris, PEA-eligible)
- ESE – S&P 500 (United States)
- PUST – Nasdaq-100 (United States, growth)
- MEUD – STOXX Europe 600 (Europe)
- PAEEM – MSCI Emerging Markets
You can replace each of the 4 ETFs in the settings.
Optional regime filter (off by default)
- If you enable it, the indicator checks the benchmark ETF (default CW8, MSCI World) at each monthly rotation. If the benchmark closes below its 200-day simple moving average, the strategy holds the benchmark instead of the best-scored ETF.
- Benchmark and moving average length are adjustable. With the filter off, the behaviour is the pure rotation described above.
How to read it
- Table (top right by default): ETF of the month and its ticker. If the name and the colour of the curve change, it is a rotation signal. If not, nothing to do.
- Equity curve: compounded from the first bar, then rescaled to match the chart price on the anchor date (default 10 June 2019). Load the indicator on a world ETF such as CW8 (MSCI World) on the Daily timeframe to compare the strategy with a buy-and-hold on the same dates.
- Legend table: one colour per ETF.
Settings
- The 4 ETFs, the volatility lookback, the anchor date, the optional regime filter (on/off, benchmark, MA length), and the position and size of the tables.
Important notes
- Works on the Daily timeframe only (the script displays a message otherwise).
- The universe is small and fixed on purpose: fewer rules, fewer parameters to over-optimise.
- Real life differs from a backtest: brokerage fees, spreads, execution at the monthly close and ETF eligibility can change over time.
- This script is educational and is not financial advice.
Phát hành các Ghi chú
Updated chart preview (CW8, Daily).Phát hành các Ghi chú
update screen
Thông báo miễn trừ trách nhiệm
Thông tin và các ấn phẩm này không nhằm mục đích, và không cấu thành, lời khuyên hoặc khuyến nghị về tài chính, đầu tư, giao dịch hay các loại khác do TradingView cung cấp hoặc xác nhận. Đọc thêm tại Điều khoản Sử dụng.
Thông báo miễn trừ trách nhiệm
Thông tin và các ấn phẩm này không nhằm mục đích, và không cấu thành, lời khuyên hoặc khuyến nghị về tài chính, đầu tư, giao dịch hay các loại khác do TradingView cung cấp hoặc xác nhận. Đọc thêm tại Điều khoản Sử dụng.