Gamma Regime Flag
Gamma Regime Flag
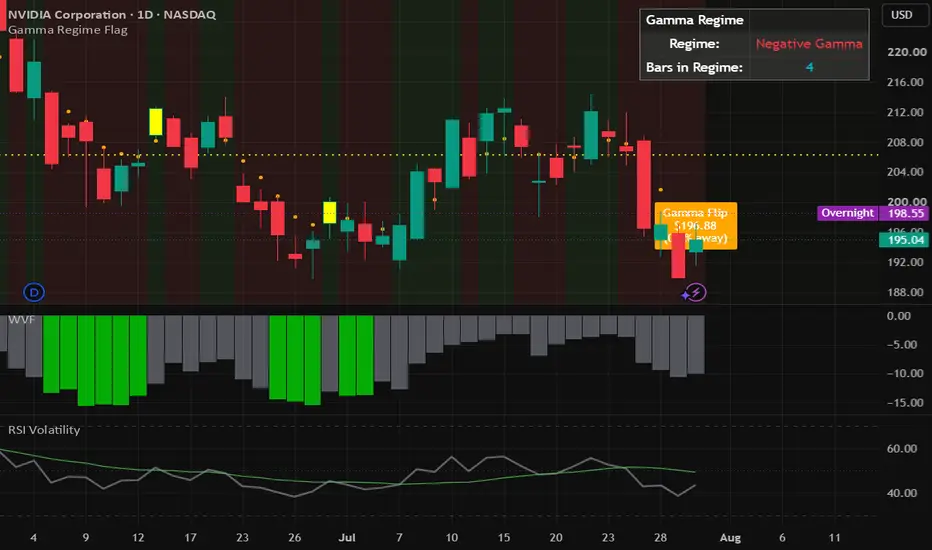
Flags whether price is trading above or below an estimated gamma flip level — the zone where dealer/market-maker hedging flow is thought to shift character (supportive vs. amplifying). This is a simplified, single-purpose read: just the flip line and the regime state, nothing else.
How it works:
The flip level is approximated using VWAP as an anchor, lightly smoothed with an EMA to reduce noise. When price is above the flip, the background shades one color (Positive Gamma); below it, the other (Negative Gamma). A small table in the corner shows the current regime and how many bars price has held on that side, so you can see how "sticky" the current regime has been.
How to use it:
Positive gamma regimes have historically been associated with more mean-reverting, range-bound price action, since dealer hedging tends to dampen moves. Negative gamma regimes have been associated with more trending, volatile action, since hedging flow can amplify moves in the same direction. Use the regime as context alongside your own setup — not as a standalone signal.
Inputs:
Flip Line Smoothing — controls how reactive vs. smooth the flip level is
Show Info Table / Show Flip Label — toggle the on-chart readouts
Background and line colors — fully customizable
Alerts:
Includes an alert condition for when price crosses the gamma flip level.
Notes:
This is an educational tool that approximates gamma positioning using price and volume data — it does not use live options chain data. It is not financial advice. Past performance does not guarantee future results.
Flags whether price is trading above or below an estimated gamma flip level — the zone where dealer/market-maker hedging flow is thought to shift character (supportive vs. amplifying). This is a simplified, single-purpose read: just the flip line and the regime state, nothing else.
How it works:
The flip level is approximated using VWAP as an anchor, lightly smoothed with an EMA to reduce noise. When price is above the flip, the background shades one color (Positive Gamma); below it, the other (Negative Gamma). A small table in the corner shows the current regime and how many bars price has held on that side, so you can see how "sticky" the current regime has been.
How to use it:
Positive gamma regimes have historically been associated with more mean-reverting, range-bound price action, since dealer hedging tends to dampen moves. Negative gamma regimes have been associated with more trending, volatile action, since hedging flow can amplify moves in the same direction. Use the regime as context alongside your own setup — not as a standalone signal.
Inputs:
Flip Line Smoothing — controls how reactive vs. smooth the flip level is
Show Info Table / Show Flip Label — toggle the on-chart readouts
Background and line colors — fully customizable
Alerts:
Includes an alert condition for when price crosses the gamma flip level.
Notes:
This is an educational tool that approximates gamma positioning using price and volume data — it does not use live options chain data. It is not financial advice. Past performance does not guarantee future results.

Thông báo miễn trừ trách nhiệm
Thông tin và các ấn phẩm này không nhằm mục đích, và không cấu thành, lời khuyên hoặc khuyến nghị về tài chính, đầu tư, giao dịch hay các loại khác do TradingView cung cấp hoặc xác nhận. Đọc thêm tại Điều khoản Sử dụng.
Thông báo miễn trừ trách nhiệm
Thông tin và các ấn phẩm này không nhằm mục đích, và không cấu thành, lời khuyên hoặc khuyến nghị về tài chính, đầu tư, giao dịch hay các loại khác do TradingView cung cấp hoặc xác nhận. Đọc thêm tại Điều khoản Sử dụng.