OPEN-SOURCE SCRIPT
Elder Unified Trading System
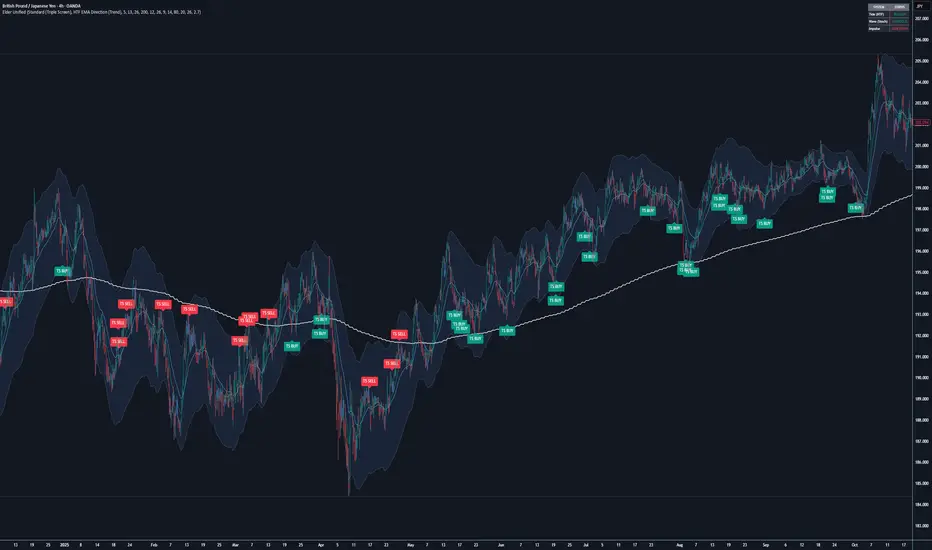
Description:
1. Philosophy & Concept
This strategy is a modern implementation of Dr. Alexander Elder’s legendary "Triple Screen Trading System" and the "Impulse System." The core philosophy is to filter every trading decision through three distinct timeframes ("Screens") to minimize risk and align with the dominant market force:
Screen 1 (The Tide): The long-term trend (Higher Timeframe).
Screen 2 (The Wave): Intermediate corrections/pullbacks on the current chart.
Screen 3 (The Ripple): The specific entry trigger when momentum realigns with the trend.
2. Why This Script Was Tuned? (The Enhancement)
In the classic Elder definition, the "Tide" is determined strictly by the slope of the Weekly MACD Histogram.
The Tuning: In strongly trending markets (like Gold or Crypto), deep pullbacks often cause the MACD Histogram on the higher timeframe to slope down temporarily. This results in valid Dip-Buying opportunities being rejected because the strict filter turns the "Traffic Light" red too early.
The Solution (v2.1 Tuning): We introduced a "Tide Filter Mode" selector:
Classic Mode: Uses MACD Slope (Very strict, fewer signals).
Trend Mode (Default): Uses the HTF EMA 200. As long as the price is above the HTF EMA 200, the trend is considered Bullish. This allows the strategy to capture high-probability pullbacks in strong trends without being filtered out prematurely.
3. Key Features
Unified Dashboard: Monitors the Tide (HTF), Wave (Stochastic), and Impulse (Momentum) status in a single, non-intrusive panel.
Dual-Signal Logic: Supports both "Swing Pullback" traders and "Momentum Breakout" traders.
Visual EMAs: Automatically displays the Tactical EMAs (13 & 26) for short-term crossovers and the Strategic EMA (200) for the major trend baseline.
Impulse Coloring: Bars are colored Green (Bullish), Red (Bearish), or Blue (Neutral) based on the combined momentum of EMA and MACD.
4. How to Use (Strategy Guide)
Select your Trading Mode in the settings menu:
A. STANDARD MODE (Triple Screen / Swing)
Best for traders who prefer buying "on sale" during a trend.
BUY Rules:
Screen 1: HTF is Bullish (Price > HTF EMA 200).
Screen 2: Stochastic drops into Oversold (<20) or crosses back up.
Screen 3: Price breaks above the previous candle's High.
Visual: "TS Buy" Label (Lime Green).
SELL Rules: The inverse of Buy (HTF Bearish + Stoch Overbought).
B. AGGRESSIVE MODE (Impulse Momentum)
Best for traders who prefer catching breakouts and strong momentum moves.
BUY Rules:
Screen 1: HTF is Bullish.
Screen 2: The candle turns GREEN (Impulse System: EMA 13 rising + MACD Hist rising).
Visual: Small "Mom" Triangle (Teal).
C. HYBRID MODE
Displays both signal types simultaneously for a complete market overview.
5. Settings
Tide Filter (Screen 1): Set to "HTF EMA Direction" for responsive trend-following (recommended), or "MACD Slope" for the strict classic method.
HTF Multiplier: The time factor for the Higher Timeframe. (e.g., Input 5 on a 15m chart = H1 Trend Data).
Show Tactical EMAs: Toggles the visibility of the EMA 13 (Blue) and EMA 26 (Purple).
Disclaimer
This indicator is for educational and analytical purposes only. Past performance does not guarantee future results. Always use proper risk management and Stop Losses.
1. Philosophy & Concept
This strategy is a modern implementation of Dr. Alexander Elder’s legendary "Triple Screen Trading System" and the "Impulse System." The core philosophy is to filter every trading decision through three distinct timeframes ("Screens") to minimize risk and align with the dominant market force:
Screen 1 (The Tide): The long-term trend (Higher Timeframe).
Screen 2 (The Wave): Intermediate corrections/pullbacks on the current chart.
Screen 3 (The Ripple): The specific entry trigger when momentum realigns with the trend.
2. Why This Script Was Tuned? (The Enhancement)
In the classic Elder definition, the "Tide" is determined strictly by the slope of the Weekly MACD Histogram.
The Tuning: In strongly trending markets (like Gold or Crypto), deep pullbacks often cause the MACD Histogram on the higher timeframe to slope down temporarily. This results in valid Dip-Buying opportunities being rejected because the strict filter turns the "Traffic Light" red too early.
The Solution (v2.1 Tuning): We introduced a "Tide Filter Mode" selector:
Classic Mode: Uses MACD Slope (Very strict, fewer signals).
Trend Mode (Default): Uses the HTF EMA 200. As long as the price is above the HTF EMA 200, the trend is considered Bullish. This allows the strategy to capture high-probability pullbacks in strong trends without being filtered out prematurely.
3. Key Features
Unified Dashboard: Monitors the Tide (HTF), Wave (Stochastic), and Impulse (Momentum) status in a single, non-intrusive panel.
Dual-Signal Logic: Supports both "Swing Pullback" traders and "Momentum Breakout" traders.
Visual EMAs: Automatically displays the Tactical EMAs (13 & 26) for short-term crossovers and the Strategic EMA (200) for the major trend baseline.
Impulse Coloring: Bars are colored Green (Bullish), Red (Bearish), or Blue (Neutral) based on the combined momentum of EMA and MACD.
4. How to Use (Strategy Guide)
Select your Trading Mode in the settings menu:
A. STANDARD MODE (Triple Screen / Swing)
Best for traders who prefer buying "on sale" during a trend.
BUY Rules:
Screen 1: HTF is Bullish (Price > HTF EMA 200).
Screen 2: Stochastic drops into Oversold (<20) or crosses back up.
Screen 3: Price breaks above the previous candle's High.
Visual: "TS Buy" Label (Lime Green).
SELL Rules: The inverse of Buy (HTF Bearish + Stoch Overbought).
B. AGGRESSIVE MODE (Impulse Momentum)
Best for traders who prefer catching breakouts and strong momentum moves.
BUY Rules:
Screen 1: HTF is Bullish.
Screen 2: The candle turns GREEN (Impulse System: EMA 13 rising + MACD Hist rising).
Visual: Small "Mom" Triangle (Teal).
C. HYBRID MODE
Displays both signal types simultaneously for a complete market overview.
5. Settings
Tide Filter (Screen 1): Set to "HTF EMA Direction" for responsive trend-following (recommended), or "MACD Slope" for the strict classic method.
HTF Multiplier: The time factor for the Higher Timeframe. (e.g., Input 5 on a 15m chart = H1 Trend Data).
Show Tactical EMAs: Toggles the visibility of the EMA 13 (Blue) and EMA 26 (Purple).
Disclaimer
This indicator is for educational and analytical purposes only. Past performance does not guarantee future results. Always use proper risk management and Stop Losses.
Mã nguồn mở
Theo đúng tinh thần TradingView, tác giả của tập lệnh này đã công bố nó dưới dạng mã nguồn mở, để các nhà giao dịch có thể xem xét và xác minh chức năng. Chúc mừng tác giả! Mặc dù bạn có thể sử dụng miễn phí, hãy nhớ rằng việc công bố lại mã phải tuân theo Nội quy.

Thông báo miễn trừ trách nhiệm
Thông tin và các ấn phẩm này không nhằm mục đích, và không cấu thành, lời khuyên hoặc khuyến nghị về tài chính, đầu tư, giao dịch hay các loại khác do TradingView cung cấp hoặc xác nhận. Đọc thêm tại Điều khoản Sử dụng.
Mã nguồn mở
Theo đúng tinh thần TradingView, tác giả của tập lệnh này đã công bố nó dưới dạng mã nguồn mở, để các nhà giao dịch có thể xem xét và xác minh chức năng. Chúc mừng tác giả! Mặc dù bạn có thể sử dụng miễn phí, hãy nhớ rằng việc công bố lại mã phải tuân theo Nội quy.
Thông báo miễn trừ trách nhiệm
Thông tin và các ấn phẩm này không nhằm mục đích, và không cấu thành, lời khuyên hoặc khuyến nghị về tài chính, đầu tư, giao dịch hay các loại khác do TradingView cung cấp hoặc xác nhận. Đọc thêm tại Điều khoản Sử dụng.