Contrarian Indicator
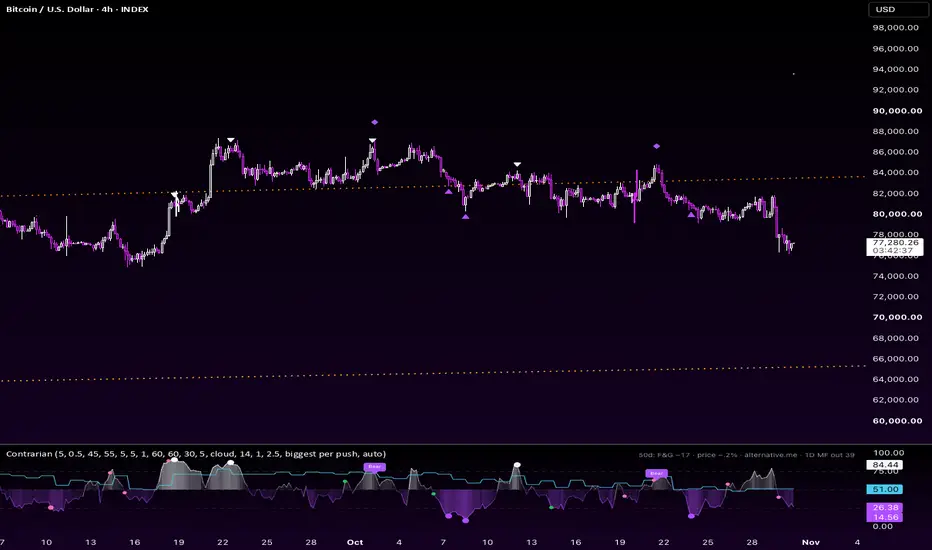
Contrarian Indicator compares price with the crypto Fear & Greed Index to find moments when the crowd's mood and the chart disagree, and pairs it with a Money Flow read so you can see whether money is actually moving in or out.
Idea by Crypto Ryan. Fear & Greed data: alternative.me.
WHAT IT SHOWS
1. Fear & Greed line (blue)
The daily crypto Fear & Greed Index in its own pane, with guide lines at 25 (fear), 50 and 75 (greed). On intraday charts each candle shows the last daily print published by the time it closed. Weekly and monthly candles show the average of the daily prints inside them.
2. Divergences between price and sentiment
Swings are found on the DAILY highs and lows, so every timeframe shows the same reads as the daily chart.
• Bull: price makes a lower low while Fear & Greed makes a higher low
• Bear: price makes a higher high while Fear & Greed makes a lower high
• H Bull (hidden): price makes a higher or equal low while Fear & Greed makes a lower low
• H Bear (hidden): price makes a lower or equal high while Fear & Greed makes a higher high
By default a divergence only counts when the index is in fear (below 45) for bullish reads or in greed (above 55) for bearish reads, and the index gap must be at least 5 points. In the pane, regular divergences get Bull / Bear tags and hidden ones get hollow diamonds. On the price chart, filled diamonds mark regular divergences and hollow diamonds mark hidden ones.
3. Money Flow
The Money Flow Index (14) on this chart's candles, drawn as a cloud from the 50 line: white when money is flowing in, purple when it is flowing out, brighter the stronger the flow. The top of a push above 80 (or the bottom below 20) is marked as a peak, in the pane and on the price chart. The newest extreme shows as hollow "peaking" until it is confirmed.
4. Big money beads
Small dots on the Money Flow line mark the biggest money candle of each push (typical price x volume, at least 2.5x the average of the 20 bars before it). Each bead is coloured by Money Flow on the next timeframe up (auto: 1H for charts up to 10m, 4H up to 1H, 1D up to 4H, 1W up to 1D), using its last closed candle: green = money coming in on the higher timeframe, pink = going out.
5. Two-month reading (top right)
Today's Fear & Greed and price compared with 60 days ago. If price is roughly flat (within 5%) while the index has moved 30+ points, it flags a hidden bullish or bearish condition. The higher timeframe's Money Flow is shown next to it (for example "4H MF in 61").
HOW TO USE IT
This is a context tool, not a buy/sell system. Divergences point out when sentiment and price are telling different stories: extreme fear while price holds up, or greed while price stalls. Use it alongside your own levels, structure and risk management.
IMPORTANT NOTES
• Fear & Greed is a crypto-wide sentiment index, so the divergence reads are meant for crypto charts. Money Flow works on any chart with volume.
• Divergence marks appear once a swing is confirmed, 5 daily candles after it by default ("Swing: days to the right"). They are then drawn on the candle that holds the swing, so they are not visible in real time at that candle. Money Flow peaks confirm 5 bars after the peak in the same way.
• Beads use the higher timeframe's last CLOSED candle, so they do not repaint.
• Pine Script cannot fetch the Fear & Greed Index, so the daily history is stored inside the script (1 Feb 2018 to 28 Oct 2026). Days after the last stored print hold that print until the script is updated.
SETTINGS
Every piece has its own on/off switch, and every colour has its own picker: the F&G line, divergence types, pane tags, price-chart diamonds, divergence lines (off by default), Money Flow style (cloud or columns), length, smoothing, peaks, beads, the big-money threshold, the higher timeframe, guide lines and the corner text. You can also set the fear and greed thresholds, the minimum index gap, swing lengths and the two-month rule.
This script is for education and information only. It is not financial advice.
Idea by Crypto Ryan. Fear & Greed data: alternative.me.
WHAT IT SHOWS
1. Fear & Greed line (blue)
The daily crypto Fear & Greed Index in its own pane, with guide lines at 25 (fear), 50 and 75 (greed). On intraday charts each candle shows the last daily print published by the time it closed. Weekly and monthly candles show the average of the daily prints inside them.
2. Divergences between price and sentiment
Swings are found on the DAILY highs and lows, so every timeframe shows the same reads as the daily chart.
• Bull: price makes a lower low while Fear & Greed makes a higher low
• Bear: price makes a higher high while Fear & Greed makes a lower high
• H Bull (hidden): price makes a higher or equal low while Fear & Greed makes a lower low
• H Bear (hidden): price makes a lower or equal high while Fear & Greed makes a higher high
By default a divergence only counts when the index is in fear (below 45) for bullish reads or in greed (above 55) for bearish reads, and the index gap must be at least 5 points. In the pane, regular divergences get Bull / Bear tags and hidden ones get hollow diamonds. On the price chart, filled diamonds mark regular divergences and hollow diamonds mark hidden ones.
3. Money Flow
The Money Flow Index (14) on this chart's candles, drawn as a cloud from the 50 line: white when money is flowing in, purple when it is flowing out, brighter the stronger the flow. The top of a push above 80 (or the bottom below 20) is marked as a peak, in the pane and on the price chart. The newest extreme shows as hollow "peaking" until it is confirmed.
4. Big money beads
Small dots on the Money Flow line mark the biggest money candle of each push (typical price x volume, at least 2.5x the average of the 20 bars before it). Each bead is coloured by Money Flow on the next timeframe up (auto: 1H for charts up to 10m, 4H up to 1H, 1D up to 4H, 1W up to 1D), using its last closed candle: green = money coming in on the higher timeframe, pink = going out.
5. Two-month reading (top right)
Today's Fear & Greed and price compared with 60 days ago. If price is roughly flat (within 5%) while the index has moved 30+ points, it flags a hidden bullish or bearish condition. The higher timeframe's Money Flow is shown next to it (for example "4H MF in 61").
HOW TO USE IT
This is a context tool, not a buy/sell system. Divergences point out when sentiment and price are telling different stories: extreme fear while price holds up, or greed while price stalls. Use it alongside your own levels, structure and risk management.
IMPORTANT NOTES
• Fear & Greed is a crypto-wide sentiment index, so the divergence reads are meant for crypto charts. Money Flow works on any chart with volume.
• Divergence marks appear once a swing is confirmed, 5 daily candles after it by default ("Swing: days to the right"). They are then drawn on the candle that holds the swing, so they are not visible in real time at that candle. Money Flow peaks confirm 5 bars after the peak in the same way.
• Beads use the higher timeframe's last CLOSED candle, so they do not repaint.
• Pine Script cannot fetch the Fear & Greed Index, so the daily history is stored inside the script (1 Feb 2018 to 28 Oct 2026). Days after the last stored print hold that print until the script is updated.
SETTINGS
Every piece has its own on/off switch, and every colour has its own picker: the F&G line, divergence types, pane tags, price-chart diamonds, divergence lines (off by default), Money Flow style (cloud or columns), length, smoothing, peaks, beads, the big-money threshold, the higher timeframe, guide lines and the corner text. You can also set the fear and greed thresholds, the minimum index gap, swing lengths and the two-month rule.
This script is for education and information only. It is not financial advice.

Thông báo miễn trừ trách nhiệm
Thông tin và các ấn phẩm này không nhằm mục đích, và không cấu thành, lời khuyên hoặc khuyến nghị về tài chính, đầu tư, giao dịch hay các loại khác do TradingView cung cấp hoặc xác nhận. Đọc thêm tại Điều khoản Sử dụng.
Thông báo miễn trừ trách nhiệm
Thông tin và các ấn phẩm này không nhằm mục đích, và không cấu thành, lời khuyên hoặc khuyến nghị về tài chính, đầu tư, giao dịch hay các loại khác do TradingView cung cấp hoặc xác nhận. Đọc thêm tại Điều khoản Sử dụng.