OPEN-SOURCE SCRIPT
Fair Value Gaps (HTF)
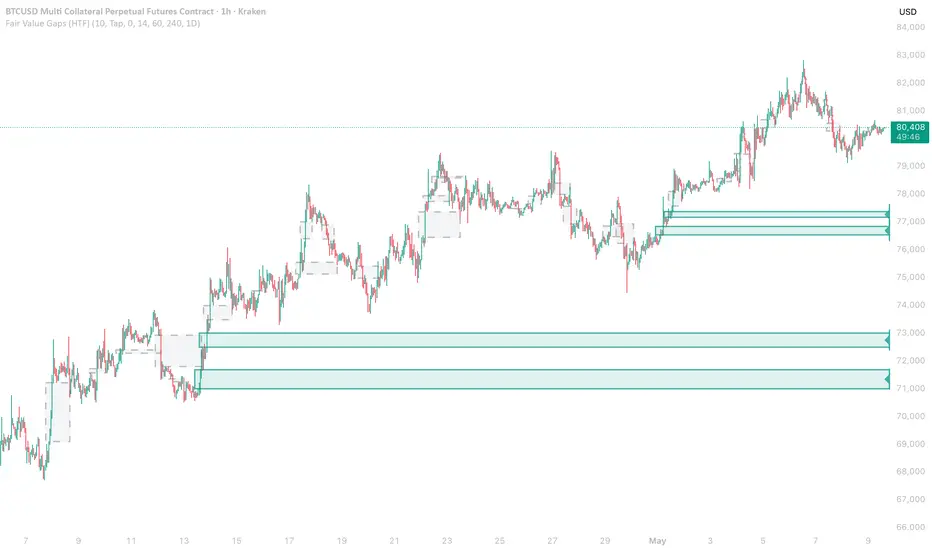
Fair Value Gaps (HTF)
Detects three-candle imbalance patterns — fair value gaps — across up to three higher timeframes, plotted as filled zones on the chart. A bullish FVG forms when a strong up-displacement leaves an unfilled gap between the previous candle's high and the next candle's low. A bearish FVG is the mirror: a down-displacement leaves a gap between the previous low and the next high.
Each timeframe renders with a distinct border weight (thin → medium → thick), so higher-timeframe FVGs stand out at a glance without colliding with the bullish/bearish colors. Active zones extend to the right until price mitigates them; mitigated zones are dimmed and optionally kept on chart for context.
How it works
For each of the three configured timeframes, the script runs FVG detection inside request.security:
New FVGs are added to the timeframe's history if they pass the optional minimum-size filter (gap height as a percentage of ATR). On every chart bar, all unmitigated FVGs are checked against current price using the configured mitigation rule:
Once a zone is mitigated, the mitigation timestamp is stored, the zone stops extending right, and it re-renders dimmed and dashed. All boxes and labels are rebuilt on the last bar so styling stays current.
How to read it
Each timeframe is differentiated by border weight: thin for TF1, medium for TF2, thick for TF3. This lets the colors carry direction (bullish vs bearish) while the borders carry timeframe — useful when zones from multiple horizons stack up in the same area, since the relative weight tells you which is the more structural anchor.
Active zones extend to the right edge. Their labels show timeframe, type (BFVG / SFVG), and the gap size as a percentage of ATR — a quick read on whether the zone is structurally meaningful or barely-there noise.
Mitigated zones stop at their mitigation point, switch to a dashed border, and fade. They're optional context — turn them off if the chart gets busy, leave them on to track historical zones that have already been worked.
When zones from different timeframes stack at the same price, that's confluence. A small intraday FVG sitting inside an unmitigated daily FVG is structurally more interesting than either zone in isolation.
Inputs
Built-in alerts
The "entered" alerts use the active mitigation rule, so changing the mitigation trigger changes when these fire.
Notes
The three mitigation rules answer different questions. Tap flags the moment any wick reaches the zone — useful for traders who fade the first touch. Close inside waits for confirmation that price is actually trading inside the gap rather than just probing it. Full fill is the strictest — the gap is only "mitigated" once price has cleared the far side. Most SMC/ICT material assumes Tap; classical price-action work tends toward Close inside or Full fill. The right choice depends on how you intend to act on the zone, not on which is "correct."
The min-size filter expressed as a percentage of ATR is more useful than an absolute size threshold. It scales naturally across instruments and timeframes — setting it to 25%, for example, ignores any FVG smaller than a quarter of recent average true range without forcing you to retune per ticker.
The default timeframes (15min, 1H, Daily) are tuned for intraday and short-swing work, where FVGs are most actively used. For higher-timeframe structural FVGs, push them up — Daily, Weekly, Monthly is a reasonable swing/position setup.
The framework here borrows from Smart Money Concepts / ICT trading, where the underlying claim is that price tends to return to fill imbalances before continuing. Whether you accept that as causal or just descriptive, the indicator is purely mechanical: it finds the patterns and tracks whether they've been touched.
This is a structural tool, not a signal generator. It marks where displacement left an imbalance and tracks whether price has revisited it.
Five years of work on a trading system left me with dozens of indicators that ultimately didn't earn a place in the final build. They're not failures — they're tools that solved problems I no longer needed solved. So instead of shelving them, I'm publishing the majority of them open-source.
If you're a discretionary trader, take what's useful. If you're a systems builder, the source is yours to dissect, modify, and improve. The best return on five years of work is for it to keep working — for someone.
If you use this script — or part of it — in your own work, please credit the original with a link back to my profile.
Note: these indicators have been updated to Pine Script v6 — some manually, some with AI assistance.
Detects three-candle imbalance patterns — fair value gaps — across up to three higher timeframes, plotted as filled zones on the chart. A bullish FVG forms when a strong up-displacement leaves an unfilled gap between the previous candle's high and the next candle's low. A bearish FVG is the mirror: a down-displacement leaves a gap between the previous low and the next high.
Each timeframe renders with a distinct border weight (thin → medium → thick), so higher-timeframe FVGs stand out at a glance without colliding with the bullish/bearish colors. Active zones extend to the right until price mitigates them; mitigated zones are dimmed and optionally kept on chart for context.
How it works
For each of the three configured timeframes, the script runs FVG detection inside request.security:
- Bullish FVG when low > high[2] — the current bar's low sits above the high two bars ago, leaving an unfilled gap on the middle candle.
- Bearish FVG when high < low[2] — the current bar's high sits below the low two bars ago.
New FVGs are added to the timeframe's history if they pass the optional minimum-size filter (gap height as a percentage of ATR). On every chart bar, all unmitigated FVGs are checked against current price using the configured mitigation rule:
- Tap — first wick touches the zone
- Close inside — bar closes inside the zone
- Full fill — close moves beyond the far boundary
Once a zone is mitigated, the mitigation timestamp is stored, the zone stops extending right, and it re-renders dimmed and dashed. All boxes and labels are rebuilt on the last bar so styling stays current.
How to read it
Each timeframe is differentiated by border weight: thin for TF1, medium for TF2, thick for TF3. This lets the colors carry direction (bullish vs bearish) while the borders carry timeframe — useful when zones from multiple horizons stack up in the same area, since the relative weight tells you which is the more structural anchor.
Active zones extend to the right edge. Their labels show timeframe, type (BFVG / SFVG), and the gap size as a percentage of ATR — a quick read on whether the zone is structurally meaningful or barely-there noise.
Mitigated zones stop at their mitigation point, switch to a dashed border, and fade. They're optional context — turn them off if the chart gets busy, leave them on to track historical zones that have already been worked.
When zones from different timeframes stack at the same price, that's confluence. A small intraday FVG sitting inside an unmitigated daily FVG is structurally more interesting than either zone in isolation.
Inputs
- Bullish / Bearish FVGs — toggle each direction independently.
- Show mitigated — keep mitigated zones on chart as historical context. Default on.
- Labels — show or hide the right-edge label with timeframe, type, and ATR%. Default on.
- Max FVGs (per TF) — cap on the number of unmitigated zones drawn per timeframe. Default 10.
- Mitigation trigger — Tap, Close inside, or Full fill. Default Tap.
- Min size (% of ATR) — filter out FVGs smaller than this percentage of ATR. Default 0 (no filter).
- ATR Length — period for the ATR used by the size filter and the labels. Default 14.
- Timeframes 1/2/3 — defaults: 15min, 1H, Daily. Each independently enabled. TF3 off by default.
- Colors — bullish, bearish, mitigated.
Built-in alerts
- New Bullish FVG — fires when a new bullish FVG is detected on any enabled timeframe
- New Bearish FVG — same, for bearish
- Price entered Bullish FVG — fires the first bar price interacts with any unmitigated bullish FVG (across all enabled timeframes)
- Price entered Bearish FVG — same, for bearish
The "entered" alerts use the active mitigation rule, so changing the mitigation trigger changes when these fire.
Notes
The three mitigation rules answer different questions. Tap flags the moment any wick reaches the zone — useful for traders who fade the first touch. Close inside waits for confirmation that price is actually trading inside the gap rather than just probing it. Full fill is the strictest — the gap is only "mitigated" once price has cleared the far side. Most SMC/ICT material assumes Tap; classical price-action work tends toward Close inside or Full fill. The right choice depends on how you intend to act on the zone, not on which is "correct."
The min-size filter expressed as a percentage of ATR is more useful than an absolute size threshold. It scales naturally across instruments and timeframes — setting it to 25%, for example, ignores any FVG smaller than a quarter of recent average true range without forcing you to retune per ticker.
The default timeframes (15min, 1H, Daily) are tuned for intraday and short-swing work, where FVGs are most actively used. For higher-timeframe structural FVGs, push them up — Daily, Weekly, Monthly is a reasonable swing/position setup.
The framework here borrows from Smart Money Concepts / ICT trading, where the underlying claim is that price tends to return to fill imbalances before continuing. Whether you accept that as causal or just descriptive, the indicator is purely mechanical: it finds the patterns and tracks whether they've been touched.
This is a structural tool, not a signal generator. It marks where displacement left an imbalance and tracks whether price has revisited it.
Five years of work on a trading system left me with dozens of indicators that ultimately didn't earn a place in the final build. They're not failures — they're tools that solved problems I no longer needed solved. So instead of shelving them, I'm publishing the majority of them open-source.
If you're a discretionary trader, take what's useful. If you're a systems builder, the source is yours to dissect, modify, and improve. The best return on five years of work is for it to keep working — for someone.
If you use this script — or part of it — in your own work, please credit the original with a link back to my profile.
Note: these indicators have been updated to Pine Script v6 — some manually, some with AI assistance.
Mã nguồn mở
Theo đúng tinh thần TradingView, tác giả của tập lệnh này đã công bố nó dưới dạng mã nguồn mở, để các nhà giao dịch có thể xem xét và xác minh chức năng. Chúc mừng tác giả! Mặc dù bạn có thể sử dụng miễn phí, hãy nhớ rằng việc công bố lại mã phải tuân theo Nội quy.

Thông báo miễn trừ trách nhiệm
Thông tin và các ấn phẩm này không nhằm mục đích, và không cấu thành, lời khuyên hoặc khuyến nghị về tài chính, đầu tư, giao dịch hay các loại khác do TradingView cung cấp hoặc xác nhận. Đọc thêm tại Điều khoản Sử dụng.
Mã nguồn mở
Theo đúng tinh thần TradingView, tác giả của tập lệnh này đã công bố nó dưới dạng mã nguồn mở, để các nhà giao dịch có thể xem xét và xác minh chức năng. Chúc mừng tác giả! Mặc dù bạn có thể sử dụng miễn phí, hãy nhớ rằng việc công bố lại mã phải tuân theo Nội quy.
Thông báo miễn trừ trách nhiệm
Thông tin và các ấn phẩm này không nhằm mục đích, và không cấu thành, lời khuyên hoặc khuyến nghị về tài chính, đầu tư, giao dịch hay các loại khác do TradingView cung cấp hoặc xác nhận. Đọc thêm tại Điều khoản Sử dụng.