CTZ Swing Exhaustion Levels
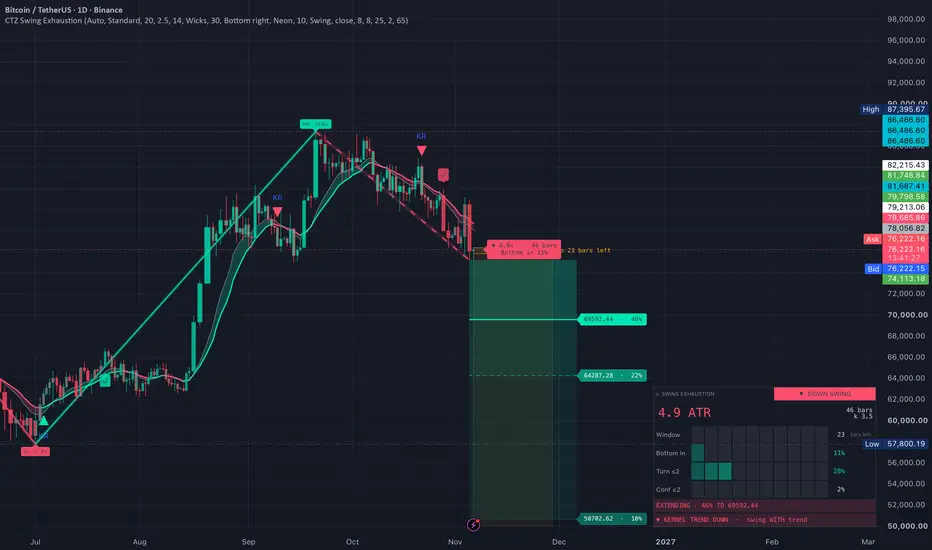
CTZ Swing Exhaustion Levels
Where does this swing end, and when? Statistical swing targets + kernel trend, tuned for crypto.
━━━━━━━━━━━━━━━━━━
WHAT IT DOES
━━━━━━━━━━━━━━━━━━
Most indicators tell you a swing has ended after it's over. This one estimates WHERE and WHEN the live swing is likely to end, using the chart's own history of past swings.
It tracks every swing on your chart (measured in ATR), learns how far and how long swings of this size usually run, and projects:
• 3 exhaustion levels (50% / 75% / 90%)
• A time window for when the swing is likely to finish
• Live odds that the top or bottom is already in
• A kernel regression trend, so you know whether the swing is moving WITH or AGAINST the trend
━━━━━━━━━━━━━━━━━━
HOW TO READ THE LEVELS
━━━━━━━━━━━━━━━━━━
Of past swings that got as far as the current one and kept going:
• 50% level: half ended before this price
• 75% level: three quarters ended before this price
• 90% level: 9 out of 10 ended before this price (tail risk)
Each label shows the chance price reaches that level from here.
These are NOT targets to hit one after another. They're the likely range of where THIS swing ends.
The levels move only when the swing makes a new extreme. The odds update every bar.
━━━━━━━━━━━━━━━━━━
WHAT HAPPENS AFTER A BOUNCE
━━━━━━━━━━━━━━━━━━
• Small bounce (less than k × ATR): the swing is still alive. A new extreme recalculates the levels further out.
• Big bounce (k × ATR or more): the swing is confirmed over. It's labelled HH / LH / HL / LL, the levels clear, and the new swing gets its own levels.
━━━━━━━━━━━━━━━━━━
BUILT FOR CRYPTO
━━━━━━━━━━━━━━━━━━
Crypto swings run further and wick harder than other markets. Market = Auto switches to crypto presets on crypto charts:
• Micro k = 2.0 | Standard k = 3.5 | Major k = 5.5
(Other markets: 1.5 / 2.5 / 4.0)
Stop hunts and liquidation wicks no longer end a swing early.
━━━━━━━━━━━━━━━━━━
KERNEL TREND
━━━━━━━━━━━━━━━━━━
A Nadaraya-Watson kernel regression (rational quadratic + gaussian) shows the underlying trend:
• Green line = trend up, red line = trend down
• Panel row: "swing WITH trend" or "swing AGAINST trend"
• Optional candle tint by trend
Uses past bars only, so it doesn't repaint once a bar has closed.
━━━━━━━━━━━━━━━━━━
CONFLUENCE SIGNALS
━━━━━━━━━━━━━━━━━━
KR ▲ / ▼: the swing is in its turn zone (or the top/bottom is likely in) AND the kernel trend turns
✓ : a swing low or high is confirmed in the direction of the kernel trend
Both need the swing statistics and the trend to agree, which filters out a lot of noise.
━━━━━━━━━━━━━━━━━━
THE PANEL
━━━━━━━━━━━━━━━━━━
• Swing size (ATR) and age (bars)
• Window: bars left in the usual time window, or how far past it (overdue)
• Top in / Bottom in: chance the swing has already ended
• Turn / Conf: chance of a turn or confirmation within the next few bars
• Status: Extending / In turn zone / Likely in / Overdue
• Kernel trend and whether the swing is with or against it
━━━━━━━━━━━━━━━━━━
HOW TO USE IT
━━━━━━━━━━━━━━━━━━
1. Use the 50% level as the first reaction zone and the 75% level as the main exhaustion zone
2. Combine levels with the time window. Price AND time lining up is the strongest setup
3. Expect wicks through levels into liquidity. Look for the RECLAIM, not the first touch
4. Wait for a KR or ✓ signal before acting on a turn
5. Best on 4H, Daily and above. Lower timeframes work, but swings are noisier
━━━━━━━━━━━━━━━━━━
ALERTS
━━━━━━━━━━━━━━━━━━
Level tagged • Top/bottom likely in • Swing confirmed • Overdue • Turn/Conf odds • Confluence signals • Kernel trend change
(Create one alert using "Any alert() function call")
━━━━━━━━━━━━━━━━━━
NOTES
━━━━━━━━━━━━━━━━━━
• The odds need about 20 past swings in each direction before they show (adjustable). Use a chart with plenty of history
• "Low sample" means few past swings this size, so treat those odds with caution
• Probabilities come from this chart's own history. They describe what usually happened, not what will happen
Credits: the swing engine is based on Swing Clock by GBB, used with permission. Kernel regression maths based on jdehorty's KernelFunctions.
⚠️ For educational purposes only. Not financial advice.
```

Thông báo miễn trừ trách nhiệm
Thông tin và các ấn phẩm này không nhằm mục đích, và không cấu thành, lời khuyên hoặc khuyến nghị về tài chính, đầu tư, giao dịch hay các loại khác do TradingView cung cấp hoặc xác nhận. Đọc thêm tại Điều khoản Sử dụng.
Thông báo miễn trừ trách nhiệm
Thông tin và các ấn phẩm này không nhằm mục đích, và không cấu thành, lời khuyên hoặc khuyến nghị về tài chính, đầu tư, giao dịch hay các loại khác do TradingView cung cấp hoặc xác nhận. Đọc thêm tại Điều khoản Sử dụng.