Ultimate Smart Money & Retail Suite [USR] V9
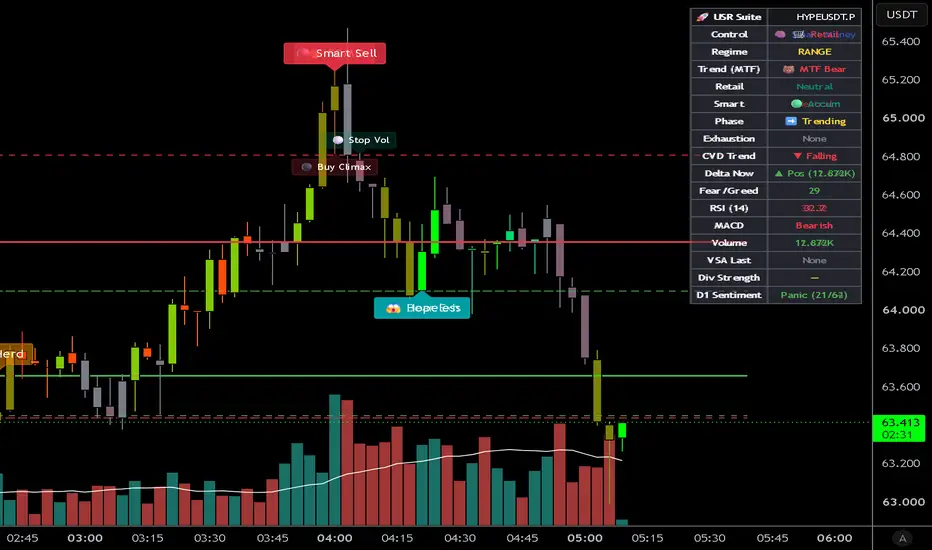
# 🚀 Ultimate Smart Money & Retail Suite V8 (USR Suite)
## 📌 Overview
The **Ultimate Smart Money & Retail Suite** is a comprehensive sentiment and volume analysis tool that combines multiple institutional-grade techniques into a single, unified oscillator. It helps traders identify:
- When **Smart Money** is accumulating or distributing.
- When **Retail traders** are trapped in FOMO or panic.
- **Volume Spread Analysis (VSA)** climaxes and stop-volumes.
- **Bullish/Bearish divergences** with strength scoring.
- **Exhaustion** and **regime shifts** (Trend, Range, Manipulation, Chop).
This is not a simple indicator—it's a complete trading suite designed for serious traders who want a 360° view of market psychology.
---
## 🧠 Core Components
### 1. Smart Money Proxy (🔵)
Combines three non-correlated metrics to estimate institutional activity:
- **MFI (Money Flow Index)** – measures buying/selling pressure with volume.
- **CMF (Chaikin Money Flow)** – captures accumulation/distribution over a longer period.
- **CVD Momentum** – detects acceleration in cumulative volume delta.
These three are normalized, smoothed with a Hull Moving Average, and displayed as the **blue line**.
---
### 2. Retail Sentiment Proxy (🔴)
Captures crowd behavior using:
- **RSI (14)** – identifies overbought/oversold extremes.
- **Percent Rank of Price (14)** – shows where price sits relative to recent range.
These are normalized, averaged, and smoothed to form the **red line**. When retail is >70, the crowd is chasing; when <30, they are panic-selling.
---
### 3. Volume Spread Analysis (VSA)
Detects high-volume anomalies with narrow/wide spreads:
- **⚪ Stop Volume** – high volume + red close + narrow spread → potential selling exhaustion (Smart Money absorbing).
- **⚫ Buying Climax** – ultra-high volume + green close + wide spread → potential distribution (Smart Money offloading).
---
### 4. Divergence Detection with Strength Scoring
Bullish and bearish divergences are identified using **confirmed pivots** (5-bar lookback). Each divergence is scored from ⭐ to ⭐⭐⭐⭐⭐ based on:
- CVD momentum alignment.
- VSA confirmation events.
- Retail depth (deeper panic / stronger FOMO).
- Smart Money strength at the pivot.
Divergences are plotted on the oscillator panel with **triangle markers** and labeled on the chart with **🔵 Smart Buy / 🔴 Smart Sell** (with dynamic cooldowns to avoid spam).
---
### 5. CVD & Delta Histogram
Displays real-time **bar delta** (buying vs selling volume) as columns on the oscillator panel:
- **Green columns** = net buying.
- **Red columns** = net selling.
- A 50-bar moving average normalizes the height for consistency.
---
### 6. Fear & Greed Index (Composite)
Combines RSI, ATR, volume direction, and Stochastic into a single 0–100 metric, displayed as an orange line on the oscillator.
---
### 7. Adaptive Zones
Overbought/oversold levels are **not fixed** at 80/20. Instead, they are calculated using **percentile ranks** (user-defined lookback), adapting to changing market volatility.
---
### 8. Real-Time Dashboard
A compact dashboard (top-right corner) displays:
- Market Control (Smart Money vs Retail).
- Current Regime (Trend / Range / Manip / Chop).
- MTF Trend (200/800 EMA alignment).
- Exhaustion status.
- CVD Trend & Current Delta.
- Fear & Greed Index.
- RSI & MACD state.
- Last VSA event.
- Divergence Strength (stars).
- Daily Timeframe Sentiment.
---
## 🔔 Signal Emojis & Cooldowns
All signals include **dynamic cooldowns** to prevent repeated alerts:
| Emoji | Signal | Description |
|-------|--------|-------------|
| 🔥 | FOMO | Breakout to new 50-bar high + RSI > 80 + 2x avg volume. |
| 🩸 | Panic | New 50-bar low + high volume + bull trend context. |
| 🐑 | Herd | 4+ green bars out of 5 + high volume + RSI > 70. |
| 🏃 | Chase | Smart Money distribution starting + Retail > 60. |
| 😴 | Bored | ADX < 14 + low volume (range-bound market). |
| 😱 | Hopeless | Smart Money accumulation + Retail < 40 + bull trend. |
| ⚡ Bull/Bear Exh | Exhaustion | Retail & Smart both at extremes + momentum reversal. |
| ⚪ Stop Vol | VSA Stop | High volume, red close, narrow spread. |
| ⚫ Buy Climax | VSA Climax | Ultra-high volume, green close, wide spread. |
---
## 📊 Trade Manager Overlay
When enabled, the indicator automatically plots **Stop-Loss and Take-Profit levels** on the price chart based on:
- **ATR (14)** – for volatility-adjusted stops.
- **Risk/Reward Ratio** – user-defined (default 2:1).
Levels appear after a bullish or bearish divergence is confirmed.
---
## ⚙️ Key Settings Overview
| Group | Key Inputs | Purpose |
|-------|------------|---------|
| **Core** | Normalization Lookback, Smoothing, Pivot Length | Controls sensitivity of the oscillator and divergence detection. |
| **VSA** | High/Ultra Volume Multipliers, Spread Multipliers | Fine-tunes Volume Spread Analysis sensitivity. |
| **Herd/Chase** | Green Bars, Volume Multiplier, RSI Threshold | Adjusts crowd behavior detection. |
| **Cooldowns** | Per-signal cooldown lengths | Prevents signal spam. |
| **Trade Manager** | ATR Multiplier, Risk/Reward Ratio | Controls SL/TP placement. |
All settings are fully configurable for different assets (crypto, stocks, forex).
---
## 🚨 Important Notes
1. **Divergences are confirmed** — they appear after the pivot is confirmed (no repainting once plotted). The built-in cooldowns also prevent re-triggering on the same pivot.
2. **Volume is required** — MFI and CMF fall back to RSI-based calculations only if volume is entirely absent (practically never in live markets).
3. **Best used on 15m – 4H timeframes** for intraday trading, but works on any timeframe.
4. **Performance** — the script is optimized with a 500-label limit and efficient calculations. Suitable for most chart setups.
---
## 📝 Recommended Workflow
1. **Identify the Regime** – Check the dashboard: is the market Trending, Ranging, or in Manipulation?
2. **Look for Divergences** – Bullish/Bearish divergences with 4–5 stars are high-probability setups.
3. **Confirm with VSA** – Stop Volume on a pullback increases confidence in bullish divergences. Buying Climax on a rally increases confidence in bearish divergences.
4. **Use the Trade Manager** – Let the indicator suggest SL/TP levels based on current volatility.
5. **Monitor the Dashboard** – Watch for shifts in Smart/Retail control and CVD direction.
---
## 📜 License
This source code is subject to the terms of the **Mozilla Public License 2.0** at mozilla.org/MPL/2.0/
Feel free to use it for personal analysis. If you find it helpful, a **like** and **follow** are greatly appreciated!
---
## 🙏 Credits
Built by **[darkaries88]** – combining years of market psychology, volume analysis, and Pine Script development into one unified tool.
*This indicator is for educational and analytical purposes only. Always conduct your own research and manage risk appropriately.*

Thông báo miễn trừ trách nhiệm
Thông tin và các ấn phẩm này không nhằm mục đích, và không cấu thành, lời khuyên hoặc khuyến nghị về tài chính, đầu tư, giao dịch hay các loại khác do TradingView cung cấp hoặc xác nhận. Đọc thêm tại Điều khoản Sử dụng.
Thông báo miễn trừ trách nhiệm
Thông tin và các ấn phẩm này không nhằm mục đích, và không cấu thành, lời khuyên hoặc khuyến nghị về tài chính, đầu tư, giao dịch hay các loại khác do TradingView cung cấp hoặc xác nhận. Đọc thêm tại Điều khoản Sử dụng.