daily highs and lows
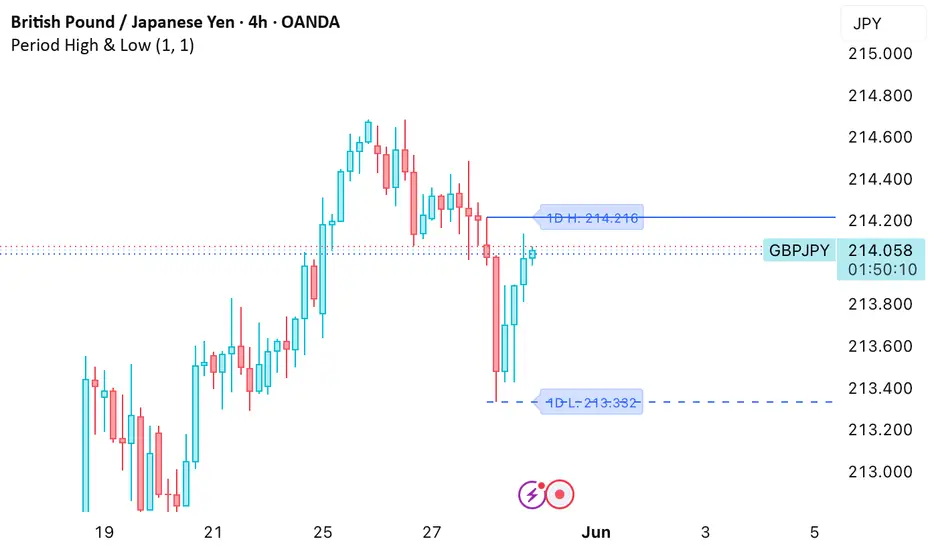
Here's a clean, simple description:
Plots the highest high and lowest low over a set number of days directly on your chart. Useful for quickly spotting key support and resistance levels without any clutter.
Settings:
Days — how far back to look
Color — line color
Line Width — thickness of the lines
Show Labels — toggle the H/L labels on or off
Extend Right — extends the lines to the right of the chart
Solid line is the high, dashed line is the low.
Plots the highest high and lowest low over a set number of days directly on your chart. Useful for quickly spotting key support and resistance levels without any clutter.
Settings:
Days — how far back to look
Color — line color
Line Width — thickness of the lines
Show Labels — toggle the H/L labels on or off
Extend Right — extends the lines to the right of the chart
Solid line is the high, dashed line is the low.

Thông báo miễn trừ trách nhiệm
Thông tin và các ấn phẩm này không nhằm mục đích, và không cấu thành, lời khuyên hoặc khuyến nghị về tài chính, đầu tư, giao dịch hay các loại khác do TradingView cung cấp hoặc xác nhận. Đọc thêm tại Điều khoản Sử dụng.
Thông báo miễn trừ trách nhiệm
Thông tin và các ấn phẩm này không nhằm mục đích, và không cấu thành, lời khuyên hoặc khuyến nghị về tài chính, đầu tư, giao dịch hay các loại khác do TradingView cung cấp hoặc xác nhận. Đọc thêm tại Điều khoản Sử dụng.