OPEN-SOURCE SCRIPT
Average Price History Candle
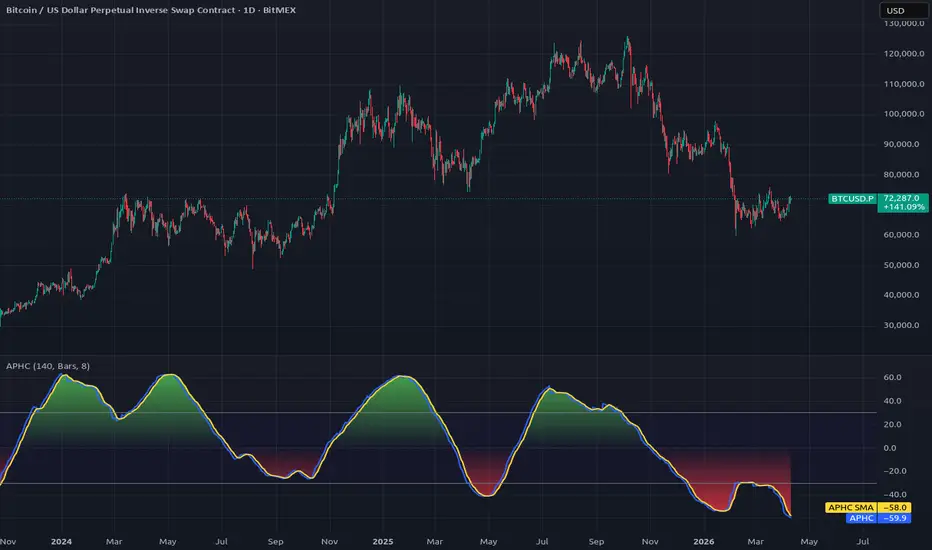
The Average Price History Candle indicator (APHC) is my own invention and is entirely new.
It's calculated from a time period, specified by a number of bars, hours or days.
It's basically one candle calculated from the average price history, with the high and low being that of the specified time period.
The open is the average (SMA) of the first half of the time period.
The close is the average (SMA) of the second half of the time period.
The plot is the size of the candle body expressed as a percentage of the whole price range, with positive being bullish and negative bearish.
It generally resembles a sine wave more or less, as the momentume shifts from bullish to bearish and back again.
Because it's fairly consistant and predictable, it gives a good indication where the market momentum is going next.
It also seems to work quite well with divergences.
Using a time period of a very few bars, say 6 or 8, it behaves more like an RSI or Stochastic.
But to be honest, I've not had much chance to explore all the different ways in which this indicator could be used to provide useful trading information.
Please leave ideas in the comments if you find ways in which you find it useful. Thanks.
It's calculated from a time period, specified by a number of bars, hours or days.
It's basically one candle calculated from the average price history, with the high and low being that of the specified time period.
The open is the average (SMA) of the first half of the time period.
The close is the average (SMA) of the second half of the time period.
The plot is the size of the candle body expressed as a percentage of the whole price range, with positive being bullish and negative bearish.
It generally resembles a sine wave more or less, as the momentume shifts from bullish to bearish and back again.
Because it's fairly consistant and predictable, it gives a good indication where the market momentum is going next.
It also seems to work quite well with divergences.
Using a time period of a very few bars, say 6 or 8, it behaves more like an RSI or Stochastic.
But to be honest, I've not had much chance to explore all the different ways in which this indicator could be used to provide useful trading information.
Please leave ideas in the comments if you find ways in which you find it useful. Thanks.
Mã nguồn mở
Theo đúng tinh thần TradingView, tác giả của tập lệnh này đã công bố nó dưới dạng mã nguồn mở, để các nhà giao dịch có thể xem xét và xác minh chức năng. Chúc mừng tác giả! Mặc dù bạn có thể sử dụng miễn phí, hãy nhớ rằng việc công bố lại mã phải tuân theo Nội quy.

Thông báo miễn trừ trách nhiệm
Thông tin và các ấn phẩm này không nhằm mục đích, và không cấu thành, lời khuyên hoặc khuyến nghị về tài chính, đầu tư, giao dịch hay các loại khác do TradingView cung cấp hoặc xác nhận. Đọc thêm tại Điều khoản Sử dụng.
Mã nguồn mở
Theo đúng tinh thần TradingView, tác giả của tập lệnh này đã công bố nó dưới dạng mã nguồn mở, để các nhà giao dịch có thể xem xét và xác minh chức năng. Chúc mừng tác giả! Mặc dù bạn có thể sử dụng miễn phí, hãy nhớ rằng việc công bố lại mã phải tuân theo Nội quy.
Thông báo miễn trừ trách nhiệm
Thông tin và các ấn phẩm này không nhằm mục đích, và không cấu thành, lời khuyên hoặc khuyến nghị về tài chính, đầu tư, giao dịch hay các loại khác do TradingView cung cấp hoặc xác nhận. Đọc thêm tại Điều khoản Sử dụng.