Cập nhật
Efficiency Divergence Oscillator
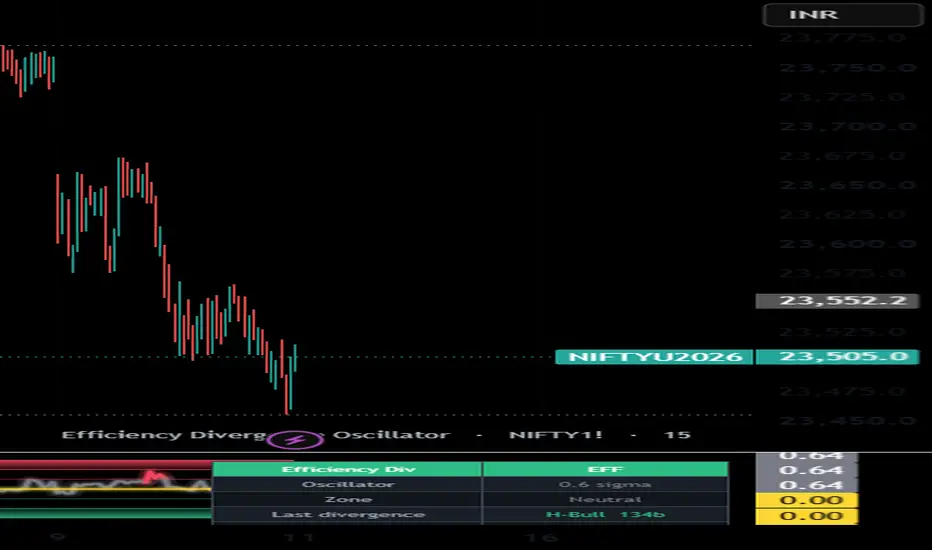
Efficiency Divergence Oscillator
## Overview
The Efficiency Divergence Oscillator turns the **signed efficiency ratio** - net price displacement divided by the total path price actually travelled - into a standardized, bounded oscillator, and then looks for **divergence between price and the efficiency of its travel**. The idea it tests: when price makes a new extreme but reaches it on an increasingly choppy, inefficient path, the move is losing conviction.
It is a single-pane oscillator. It needs no external data and no volume. Every data input is user-configurable, so it runs on any symbol, asset class or timeframe, in any market and on any timeframe. Defaults target NSE NIFTY index futures on intraday charts.
## What it plots
- A z-scored **efficiency oscillator** (clean advance = up, clean decline = down, choppy travel = near zero), with a glow line and sigma-based overbought/oversold levels.
- **Extreme-zone bands** (default +/-3 sigma) with a gradient fill that deepens toward the edge.
- **Divergence lines and labels** on the oscillator - regular (reversal) and hidden (continuation), in two colors.
- **In-band reversal dots** where the oscillator turns inside an extreme zone.
- Optional **price-pane marks** at the confirmation bar (all generated by this one indicator).
- A **background-adaptive status dashboard** (oscillator value in sigma, zone, last divergence, last reversal, signed efficiency in %).
## Why these components are combined (mashup rationale)
This script combines a **derived measure**, a **normalization stage**, a **divergence engine** and a **reversal read**, because each answers a question the others cannot and none is useful here alone:
1. **Signed efficiency ratio (path quality).** Momentum tells you how FAR price moved; it does not tell you how DIRECTLY it got there. The signed efficiency ratio = (price - price[len]) / sum(|price - price[1]|, len), a value in +/-1 that is positive for efficient up-moves and negative for efficient down-moves. It isolates path quality - a dimension a magnitude-only momentum oscillator cannot show.
2. **Standardization (rolling z-score).** efficiency differs in scale across instruments. The z-score expresses it in standard-deviation units, so "overbought/oversold" and the extreme bands mean the same thing on NIFTY, on a commodity future, or on a crypto instrument. Without this step the divergence thresholds would not transfer between symbols.
3. **Divergence engine.** The original payload is reading **price-versus-efficiency disagreement at confirmed pivots**. The engine pairs each new price pivot with the oscillator value, then requires: a genuine new price extreme; the measure failing to confirm it; a minimum oscillator gap scaled to the oscillator own stdev; the two pivots within a maximum bar distance; and optionally an overbought/oversold reading at the pivot. These gates make the combination produce signal rather than noise.
4. **Reversal read.** Independently, the engine flags oscillator turns that occur inside the extreme bands - a complementary exhaustion cue.
Together the components form one pipeline: **build the signal -> make it comparable (z-score) -> surface where price and that signal disagree (divergence) and where it exhausts (reversal).** Each is incomplete alone.
## How it works (method)
efficiency = (price - price[len]) / sum(abs(price - price[1]), len) over the efficiency window, a value in +/-1; this is standardized with a rolling z-score to the oscillator.
Regular and hidden divergence are detected from confirmed pivothigh/pivotlow pivots and filtered by the gates above; reversals are oscillator pivots that print inside the extreme bands. Pivots confirm a few bars after they occur, so a printed signal does not repaint. The confirmation lag equals the pivot length.
## How to use it
1. Add the indicator on any chart; no special data is required.
2. Read divergence as **context, not a trigger**: a bearish divergence (price higher high, efficiency lower high) says the advance is getting choppier; a bullish divergence says the decline is. Confirm with your own structure, levels and risk process.
3. Tune the **pivot length**, **max gap** and **min oscillator gap** to your timeframe; raise them for fewer, cleaner signals.
## Originality
This is an original implementation - not a efficiency line and not a generic divergence script, but the specific combination of efficiency, sigma-standardization that makes the read portable across markets, a multi-gate divergence engine (magnitude + distance + extreme-zone), hidden-divergence and in-band reversal detection, and a background-adaptive dashboard. The code is written from scratch; helper functions use only their arguments and built-ins.
## Credits
The Efficiency Ratio was introduced by **Perry J. Kaufman**. **Price/oscillator divergence** is a long-established, publicly documented technical-analysis technique. This script is not affiliated with, nor endorsed by, any third party.
## Notes / limitations
- Efficiency is a path-quality read, not a direction call; in strong clean trends it stays elevated without diverging.
- Divergence is descriptive context, never a guarantee of reversal.
- Confirmation lags each pivot by the pivot length.
## Disclaimer
Research and educational tool only. NOT financial advice and no guarantee of profitability or accuracy. Indicators describe past behaviour; they do not predict the future. Trading carries risk of loss. Test out-of-sample and make your own decisions. The author accepts no liability for any use of this script.
## Overview
The Efficiency Divergence Oscillator turns the **signed efficiency ratio** - net price displacement divided by the total path price actually travelled - into a standardized, bounded oscillator, and then looks for **divergence between price and the efficiency of its travel**. The idea it tests: when price makes a new extreme but reaches it on an increasingly choppy, inefficient path, the move is losing conviction.
It is a single-pane oscillator. It needs no external data and no volume. Every data input is user-configurable, so it runs on any symbol, asset class or timeframe, in any market and on any timeframe. Defaults target NSE NIFTY index futures on intraday charts.
## What it plots
- A z-scored **efficiency oscillator** (clean advance = up, clean decline = down, choppy travel = near zero), with a glow line and sigma-based overbought/oversold levels.
- **Extreme-zone bands** (default +/-3 sigma) with a gradient fill that deepens toward the edge.
- **Divergence lines and labels** on the oscillator - regular (reversal) and hidden (continuation), in two colors.
- **In-band reversal dots** where the oscillator turns inside an extreme zone.
- Optional **price-pane marks** at the confirmation bar (all generated by this one indicator).
- A **background-adaptive status dashboard** (oscillator value in sigma, zone, last divergence, last reversal, signed efficiency in %).
## Why these components are combined (mashup rationale)
This script combines a **derived measure**, a **normalization stage**, a **divergence engine** and a **reversal read**, because each answers a question the others cannot and none is useful here alone:
1. **Signed efficiency ratio (path quality).** Momentum tells you how FAR price moved; it does not tell you how DIRECTLY it got there. The signed efficiency ratio = (price - price[len]) / sum(|price - price[1]|, len), a value in +/-1 that is positive for efficient up-moves and negative for efficient down-moves. It isolates path quality - a dimension a magnitude-only momentum oscillator cannot show.
2. **Standardization (rolling z-score).** efficiency differs in scale across instruments. The z-score expresses it in standard-deviation units, so "overbought/oversold" and the extreme bands mean the same thing on NIFTY, on a commodity future, or on a crypto instrument. Without this step the divergence thresholds would not transfer between symbols.
3. **Divergence engine.** The original payload is reading **price-versus-efficiency disagreement at confirmed pivots**. The engine pairs each new price pivot with the oscillator value, then requires: a genuine new price extreme; the measure failing to confirm it; a minimum oscillator gap scaled to the oscillator own stdev; the two pivots within a maximum bar distance; and optionally an overbought/oversold reading at the pivot. These gates make the combination produce signal rather than noise.
4. **Reversal read.** Independently, the engine flags oscillator turns that occur inside the extreme bands - a complementary exhaustion cue.
Together the components form one pipeline: **build the signal -> make it comparable (z-score) -> surface where price and that signal disagree (divergence) and where it exhausts (reversal).** Each is incomplete alone.
## How it works (method)
efficiency = (price - price[len]) / sum(abs(price - price[1]), len) over the efficiency window, a value in +/-1; this is standardized with a rolling z-score to the oscillator.
Regular and hidden divergence are detected from confirmed pivothigh/pivotlow pivots and filtered by the gates above; reversals are oscillator pivots that print inside the extreme bands. Pivots confirm a few bars after they occur, so a printed signal does not repaint. The confirmation lag equals the pivot length.
## How to use it
1. Add the indicator on any chart; no special data is required.
2. Read divergence as **context, not a trigger**: a bearish divergence (price higher high, efficiency lower high) says the advance is getting choppier; a bullish divergence says the decline is. Confirm with your own structure, levels and risk process.
3. Tune the **pivot length**, **max gap** and **min oscillator gap** to your timeframe; raise them for fewer, cleaner signals.
## Originality
This is an original implementation - not a efficiency line and not a generic divergence script, but the specific combination of efficiency, sigma-standardization that makes the read portable across markets, a multi-gate divergence engine (magnitude + distance + extreme-zone), hidden-divergence and in-band reversal detection, and a background-adaptive dashboard. The code is written from scratch; helper functions use only their arguments and built-ins.
## Credits
The Efficiency Ratio was introduced by **Perry J. Kaufman**. **Price/oscillator divergence** is a long-established, publicly documented technical-analysis technique. This script is not affiliated with, nor endorsed by, any third party.
## Notes / limitations
- Efficiency is a path-quality read, not a direction call; in strong clean trends it stays elevated without diverging.
- Divergence is descriptive context, never a guarantee of reversal.
- Confirmation lags each pivot by the pivot length.
## Disclaimer
Research and educational tool only. NOT financial advice and no guarantee of profitability or accuracy. Indicators describe past behaviour; they do not predict the future. Trading carries risk of loss. Test out-of-sample and make your own decisions. The author accepts no liability for any use of this script.
Phát hành các Ghi chú
Efficiency Divergence Oscillator — update notesForward calibration added. Each divergence and reversal class (Reg Bull/Bear, Hidden Bull/Bear, Rev +/−) is resolved by a triple-barrier outcome, uniqueness-weighted and recency-decayed, and reported as an edge over a zone-matched base rate with a Wilson interval and a multiple-testing-corrected significance star — so you can see which efficiency (path-quality) divergences actually pay on your instrument.
Identity strip showing name · symbol · timeframe on the chart (theme-adaptive).
Exports bus: EXP_Osc, EXP_OscZ, EXP_Zone, EXP_Bias, EXP_RegDiv, EXP_HidDiv, EXP_Reversal, EXP_BullEdge, EXP_BearEdge, plus EXP_Efficiency.
Pro dashboard adds the per-class calibration table; settings reorganized into 7 groups; all toggles default-on; NIFTY/intraday defaults retained; efficiency-ratio credit (Kaufman) kept in the header, out of the UI.
Educational only — not financial advice. Efficiency is a path-quality read, not a direction call; calibration is in-sample, forward-measured. Validate out-of-sample.
Phát hành các Ghi chú
v1.1 — Four additive layers: robust normalization, a lag-minimal smoother, a 3-window extreme consensus, and a walk-forward out-of-sample reliability read. The signed efficiency-ratio engine, the divergence engine and the triple-barrier zone-matched calibration are unchanged — set Normalization = "Classic (mean/stdev)" and Smoother = "EMA" for the original read.1. Robust MAD normalization (default on). The efficiency measure can be standardized with a median/MAD z-score (median absolute deviation ×1.4826) instead of mean/stdev, so a single outlier bar doesn't blow out the sigma bands. Selectable via "Normalization".
2. UltimateSmoother (default on). When oscillator smoothing is on, it can use Ehlers' lag-minimal UltimateSmoother instead of an EMA. Selectable via "Smoother".
3. 3-window extreme consensus (opt-in, default off). z as the MEDIAN of the z at half, one and double the normalization window — extreme only when short, medium and long agree. ("Extreme normalization".)
4. Walk-forward out-of-sample reliability. The first N resolved signals TRAIN; every one after is scored OUT-OF-SAMPLE and exported as EXP_OOSEdge / EXP_OOSHit — the honest read, since an in-sample edge can flatter.
What is unchanged. The signed efficiency ratio (net move ÷ total path travelled), the standardization, the regular + hidden divergence engine, the in-band reversal read and the entire triple-barrier zone-matched forward calibration (uniqueness-weighting, recency decay, Wilson interval, Šidák correction) are byte-for-byte the published version. The new layers only read existing series.
Still research/education only — NOT financial advice. Non-repaint: late-confirming pivots, calibration resolves on confirmed bars. Concept credits unchanged (Kaufman efficiency ratio; López de Prado triple-barrier/uniqueness; Wilson; Šidák; Ehlers UltimateSmoother).
Phát hành các Ghi chú
v1.2 — R1 honest-stats standardization. Robust-z and the Wilson confidence half-width now come from the published calibration libraries (ml_robuststats/2, ml_calib/2), byte-identical to the prior local helpers — oscillator, divergence detection, marks and calibration numbers unchanged. Shared calibration engine across the divergence family.
Thông báo miễn trừ trách nhiệm
Thông tin và các ấn phẩm này không nhằm mục đích, và không cấu thành, lời khuyên hoặc khuyến nghị về tài chính, đầu tư, giao dịch hay các loại khác do TradingView cung cấp hoặc xác nhận. Đọc thêm tại Điều khoản Sử dụng.
Thông báo miễn trừ trách nhiệm
Thông tin và các ấn phẩm này không nhằm mục đích, và không cấu thành, lời khuyên hoặc khuyến nghị về tài chính, đầu tư, giao dịch hay các loại khác do TradingView cung cấp hoặc xác nhận. Đọc thêm tại Điều khoản Sử dụng.