OPEN-SOURCE SCRIPT
PnL Target/Stop Calculator $100 - $2000
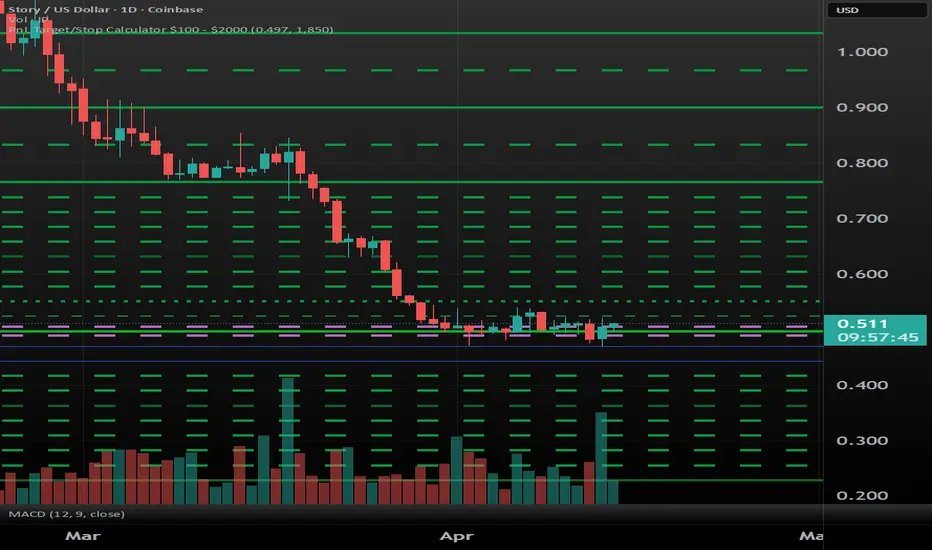
This tool plots gains and losses in $100 increments from $100 - $2000.
This can be used to find stop losses and targets based on PnL or to find the price where a specific loss or gain will occur at, and this is shown visually on chart with horizontal lines.
The user must define 2 values: The average entry price and how much is invested. This is done by going into the indicator's settings and clicking the Input tab.
Both entry and cash amount are used to determine where $100 increments of gain and loss are.
What's displayed?
- The brightest solid green line shows your entry.
- The skinniest dashed green line shows $100 loss/gain.
- The dotted green line shows $200 loss gain.
- It also contains a 1.6% stop, shown by the dashed purple lines.
- Solid green lines are $1000, $1500, and $2000.
After $1000 gain, the indicator shows gain in $250 increments up until $2000.
While PnL loss only goes up to $1000.
Here is how this is calculated:
$100 loss = [ (1-(100/cash)) * entry ].
$100 gain = [ (1+(100/cash)) * entry ]
$200 loss = [ (1-(200/cash)) * entry ].
$200 gain = [ (1+(200/cash)) * entry ]
...And so on.
To keep the horizontal lines after the indicator is removed, draw a horizontal ray or a horizontal line where the lines are drawn by the indicator and then remove the indicator after drawing the lines you wanted.
This can be used to find stop losses and targets based on PnL or to find the price where a specific loss or gain will occur at, and this is shown visually on chart with horizontal lines.
The user must define 2 values: The average entry price and how much is invested. This is done by going into the indicator's settings and clicking the Input tab.
Both entry and cash amount are used to determine where $100 increments of gain and loss are.
What's displayed?
- The brightest solid green line shows your entry.
- The skinniest dashed green line shows $100 loss/gain.
- The dotted green line shows $200 loss gain.
- It also contains a 1.6% stop, shown by the dashed purple lines.
- Solid green lines are $1000, $1500, and $2000.
After $1000 gain, the indicator shows gain in $250 increments up until $2000.
While PnL loss only goes up to $1000.
Here is how this is calculated:
$100 loss = [ (1-(100/cash)) * entry ].
$100 gain = [ (1+(100/cash)) * entry ]
$200 loss = [ (1-(200/cash)) * entry ].
$200 gain = [ (1+(200/cash)) * entry ]
...And so on.
To keep the horizontal lines after the indicator is removed, draw a horizontal ray or a horizontal line where the lines are drawn by the indicator and then remove the indicator after drawing the lines you wanted.
Mã nguồn mở
Theo đúng tinh thần TradingView, tác giả của tập lệnh này đã công bố nó dưới dạng mã nguồn mở, để các nhà giao dịch có thể xem xét và xác minh chức năng. Chúc mừng tác giả! Mặc dù bạn có thể sử dụng miễn phí, hãy nhớ rằng việc công bố lại mã phải tuân theo Nội quy.

Thông báo miễn trừ trách nhiệm
Thông tin và các ấn phẩm này không nhằm mục đích, và không cấu thành, lời khuyên hoặc khuyến nghị về tài chính, đầu tư, giao dịch hay các loại khác do TradingView cung cấp hoặc xác nhận. Đọc thêm tại Điều khoản Sử dụng.
Mã nguồn mở
Theo đúng tinh thần TradingView, tác giả của tập lệnh này đã công bố nó dưới dạng mã nguồn mở, để các nhà giao dịch có thể xem xét và xác minh chức năng. Chúc mừng tác giả! Mặc dù bạn có thể sử dụng miễn phí, hãy nhớ rằng việc công bố lại mã phải tuân theo Nội quy.
Thông báo miễn trừ trách nhiệm
Thông tin và các ấn phẩm này không nhằm mục đích, và không cấu thành, lời khuyên hoặc khuyến nghị về tài chính, đầu tư, giao dịch hay các loại khác do TradingView cung cấp hoặc xác nhận. Đọc thêm tại Điều khoản Sử dụng.