Cập nhật
RSI & Stoch Multi-TF Watchlist
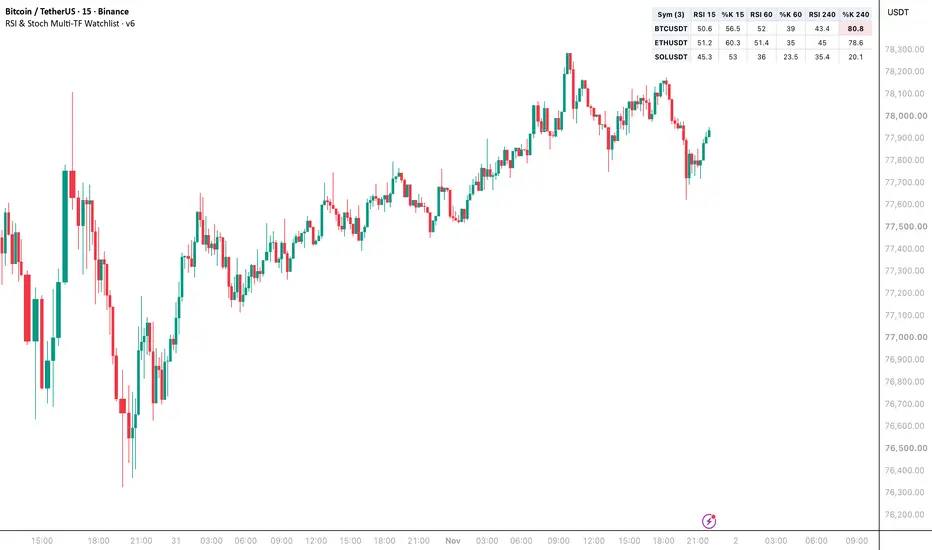
RSI and Stochastic Multi-TF Watchlist evaluates up to ten user-selected symbols and shows, in a single panel on the chart, the RSI and Stochastic values for each one on three configurable timeframes.
For every symbol the script computes the RSI and the smoothed Stochastic %K on each of the three timeframes you select. The values are displayed in a single table with color-coded cells: green when an indicator is oversold, red when overbought, gray in the neutral zone. Cells in oversold or overbought territory are bolded so extreme readings stand out at a glance.
The panel shows, for every symbol: the symbol name, then the RSI and Stochastic value pairs for timeframe one, timeframe two and timeframe three. The header shows the count of active symbols.
Settings include ten symbol picker slots (leave any empty to skip it), three timeframe inputs (the same three timeframes are used for both RSI and Stochastic), RSI length, Stochastic %K length and smooth, the overbought and oversold thresholds for both indicators, and the panel position.
Limitations. The script uses one request.security() call per symbol per timeframe, so it is capped at thirty calls (three timeframes times ten symbols) by Pine's call budget. Because of that, the same three timeframes are used for RSI and for Stochastic. If you need independent timeframes for each indicator, the symbol count has to be reduced to five or six. The companion indicator OB Watchlist Distance uses the same architecture for Order Block scanning and is published separately.
Recommended use. Configure the three timeframes to match the horizons you trade, for example fifteen minutes, one hour and four hours for intraday scanning, or four hours, one day and one week for swing context. Tune the overbought and oversold thresholds to match the volatility of your instruments.
For every symbol the script computes the RSI and the smoothed Stochastic %K on each of the three timeframes you select. The values are displayed in a single table with color-coded cells: green when an indicator is oversold, red when overbought, gray in the neutral zone. Cells in oversold or overbought territory are bolded so extreme readings stand out at a glance.
The panel shows, for every symbol: the symbol name, then the RSI and Stochastic value pairs for timeframe one, timeframe two and timeframe three. The header shows the count of active symbols.
Settings include ten symbol picker slots (leave any empty to skip it), three timeframe inputs (the same three timeframes are used for both RSI and Stochastic), RSI length, Stochastic %K length and smooth, the overbought and oversold thresholds for both indicators, and the panel position.
Limitations. The script uses one request.security() call per symbol per timeframe, so it is capped at thirty calls (three timeframes times ten symbols) by Pine's call budget. Because of that, the same three timeframes are used for RSI and for Stochastic. If you need independent timeframes for each indicator, the symbol count has to be reduced to five or six. The companion indicator OB Watchlist Distance uses the same architecture for Order Block scanning and is published separately.
Recommended use. Configure the three timeframes to match the horizons you trade, for example fifteen minutes, one hour and four hours for intraday scanning, or four hours, one day and one week for swing context. Tune the overbought and oversold thresholds to match the volatility of your instruments.
Phát hành các Ghi chú
RSI & STOCH MULTI-TF WATCHLIST — MOMENTUM STATES ACROSS MARKETSCompare RSI and smoothed Stochastic %K for up to ten symbols across three shared timeframes. The panel puts six oscillator readings beside each market, making it easier to spot whether short- and longer-interval momentum are stretched together or disagree.
Colored cells describe the current oscillator state. They do not represent a scored trade, an automatic reversal signal or a forecast.
01 / ONE WATCHLIST, THREE SHARED INTERVALS
The initial rows are BINANCE:BTCUSDT, BINANCE:ETHUSDT and BINANCE:SOLUSDT. Seven additional symbol slots are blank and omitted from the visible panel. Use the intended exchange/feed in each input; the compact row name hides its exchange prefix.
The three source timeframes initially use 15, 60 and 240 minutes. They apply to every symbol and to both oscillators. This differs from a panel with a separate timeframe for each market: changing TF 2 here changes the middle pair of columns for the entire watchlist.
Each pair contains RSI followed by %K. The header shows the actual timeframe notation. The chart symbol is a workspace host; every row obtains oscillator data from its own requested market and interval.
02 / TWO MEASURES WITH DIFFERENT INPUTS
- RSI: TradingView's RSI of the source closing price, with length 14 initially. It measures the balance of recent closing-price changes.
- Stochastic %K: the source close's location between the highest high and lowest low of the last 14 source bars, expressed on a 0–100 scale, then smoothed with a three-bar simple moving average.
The raw Stochastic calculation divides by the greater of the high–low range and the source symbol's minimum tick. This avoids a zero denominator in a flat window. It is price Stochastic, not Stochastic RSI, and the panel does not calculate or display a separate %D line.
The lengths and smoothing are shared across symbols and intervals. A length of 14 represents 14 bars of that column's source timeframe, so its clock-time span changes from one pair to the next. This update preserves those formulas.
03 / HOW THE COLORS ARE ASSIGNED
Initial RSI thresholds are 70 for overbought and 30 for oversold. Initial %K thresholds are 80 and 20.
- Rose tint and bold value: strictly above that oscillator's upper threshold.
- Teal tint and bold value: strictly below its lower threshold.
- Neutral background and regular value: between those thresholds, including a value exactly on either boundary.
Each cell is classified independently. Agreement between RSI and %K does not create an extra signal, and agreement across all three timeframes does not produce a confluence score. The panel does not require a threshold cross, an exit from an extreme, a %K/%D crossover, divergence or a price-confirmation candle.
Threshold settings alter the visual classification rather than the underlying oscillator calculation. A displayed value is rounded to one decimal place, while classification uses the full unrounded value. A value displayed as 70 can therefore be colored if its actual RSI is slightly greater than 70.
04 / READABLE PRESENTATION
The refreshed panel uses the chart theme for text and its base background, a soft blue header and configurable rose/teal state accents. Missing oscillator values now display a dash instead of a numeric-looking placeholder.
Text initially uses Small, with Tiny and Normal alternatives. Top Right is the initial position; Top Left, Bottom Right, Bottom Left, Middle Right and Bottom Center remain available. Show panel controls visibility. These display controls do not change the thirty source requests or the RSI/%K formulas.
The panel is a table rather than an oscillator plot. It does not add RSI lines, Stochastic lines, price markers, simulated orders or dedicated alertcondition definitions.
05 / UNDERSTAND WHEN A VALUE CAN CHANGE
The existing requests use gaps_off and lookahead_off, sampling the current oscillator outputs of each requested interval. Readings and colors can change before those source candles close. Looking at a closed chart candle does not necessarily mean every higher-interval source candle has also closed.
Historical and realtime availability can differ across intervals. The panel shows current context rather than a synchronized record of confirmed historical entries. If a requested timeframe is below the chart interval, the request returns sampled lower-timeframe data rather than every intrabar observation.
Updates also depend on chart executions, loaded history, feed access and market hours. A dash calls for checking data availability and initialization; it is not an additional market state. A closed market can retain its last available reading.
06 / A PRACTICAL REVIEW SEQUENCE
Start by checking the three intervals in the header. Scan the longer-interval columns for context, then compare the shorter pair for disagreement or compression toward a threshold. Open the source market when a row merits closer inspection and verify its price structure and actual oscillator behavior there.
An oscillator can remain extreme while a trend continues. The panel supplies neither an entry trigger nor a rule for allocating capital, placing a stop or taking profit. Those belong to a separately specified and evaluated process.
This update preserves symbol handling, all source requests, RSI and smoothed-%K calculations and the original strict threshold comparisons. Changes are limited to theme-aware styling, configurable state accents, readable text sizing, a clearer %K header, missing-value dashes and the initial panel position.

Thông báo miễn trừ trách nhiệm
Thông tin và các ấn phẩm này không nhằm mục đích, và không cấu thành, lời khuyên hoặc khuyến nghị về tài chính, đầu tư, giao dịch hay các loại khác do TradingView cung cấp hoặc xác nhận. Đọc thêm tại Điều khoản Sử dụng.
Thông báo miễn trừ trách nhiệm
Thông tin và các ấn phẩm này không nhằm mục đích, và không cấu thành, lời khuyên hoặc khuyến nghị về tài chính, đầu tư, giao dịch hay các loại khác do TradingView cung cấp hoặc xác nhận. Đọc thêm tại Điều khoản Sử dụng.