OPEN-SOURCE SCRIPT
AK - DCA Calculator
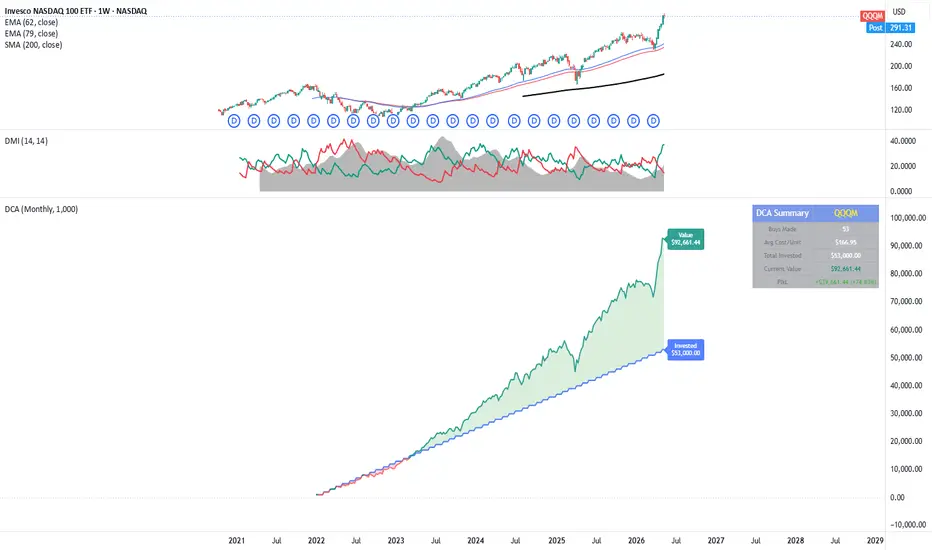
This indicator visualizes your Dollar Cost Averaging (DCA) strategy directly on your chart — no backtesting, no strategy tester, just a clean plot showing exactly where your money stands today.
What it does
Set your start date, buy frequency, and investment amount — the indicator calculates how many units you would have accumulated through consistent DCA purchases, then plots your total invested capital against your current portfolio value in a separate pane below the chart.
Features
📅 Configurable start date — model your DCA from any point in history
🔁 Three buy frequencies — Daily, Weekly, or Monthly
💵 Custom investment amount per purchase
📊 Separate pane — does not clutter your main price chart
🟢 Green fill when you're in profit, red fill when underwater
🏷️ Live labels on the last bar showing exact invested vs. current value
📋 Summary table (top-right) showing: buys made, average cost per unit, total invested, current portfolio value, and P&L in both $ and %
🎨 Fully customizable colors for all plot elements
How to use
Add the indicator to any ticker
Open Settings and set your Start Date, Buy Frequency, and Amount per Purchase
Best used on a Daily or Weekly chart for accurate frequency simulation
Works on any asset — stocks, crypto, forex, indices.
What it does
Set your start date, buy frequency, and investment amount — the indicator calculates how many units you would have accumulated through consistent DCA purchases, then plots your total invested capital against your current portfolio value in a separate pane below the chart.
Features
📅 Configurable start date — model your DCA from any point in history
🔁 Three buy frequencies — Daily, Weekly, or Monthly
💵 Custom investment amount per purchase
📊 Separate pane — does not clutter your main price chart
🟢 Green fill when you're in profit, red fill when underwater
🏷️ Live labels on the last bar showing exact invested vs. current value
📋 Summary table (top-right) showing: buys made, average cost per unit, total invested, current portfolio value, and P&L in both $ and %
🎨 Fully customizable colors for all plot elements
How to use
Add the indicator to any ticker
Open Settings and set your Start Date, Buy Frequency, and Amount per Purchase
Best used on a Daily or Weekly chart for accurate frequency simulation
Works on any asset — stocks, crypto, forex, indices.
Mã nguồn mở
Theo đúng tinh thần TradingView, tác giả của tập lệnh này đã công bố nó dưới dạng mã nguồn mở, để các nhà giao dịch có thể xem xét và xác minh chức năng. Chúc mừng tác giả! Mặc dù bạn có thể sử dụng miễn phí, hãy nhớ rằng việc công bố lại mã phải tuân theo Nội quy.

Thông báo miễn trừ trách nhiệm
Thông tin và các ấn phẩm này không nhằm mục đích, và không cấu thành, lời khuyên hoặc khuyến nghị về tài chính, đầu tư, giao dịch hay các loại khác do TradingView cung cấp hoặc xác nhận. Đọc thêm tại Điều khoản Sử dụng.
Mã nguồn mở
Theo đúng tinh thần TradingView, tác giả của tập lệnh này đã công bố nó dưới dạng mã nguồn mở, để các nhà giao dịch có thể xem xét và xác minh chức năng. Chúc mừng tác giả! Mặc dù bạn có thể sử dụng miễn phí, hãy nhớ rằng việc công bố lại mã phải tuân theo Nội quy.
Thông báo miễn trừ trách nhiệm
Thông tin và các ấn phẩm này không nhằm mục đích, và không cấu thành, lời khuyên hoặc khuyến nghị về tài chính, đầu tư, giao dịch hay các loại khác do TradingView cung cấp hoặc xác nhận. Đọc thêm tại Điều khoản Sử dụng.