OPEN-SOURCE SCRIPT
Bitcoin Power-Law, Halvings & Wyckoff Model (Macro 1W/1M)
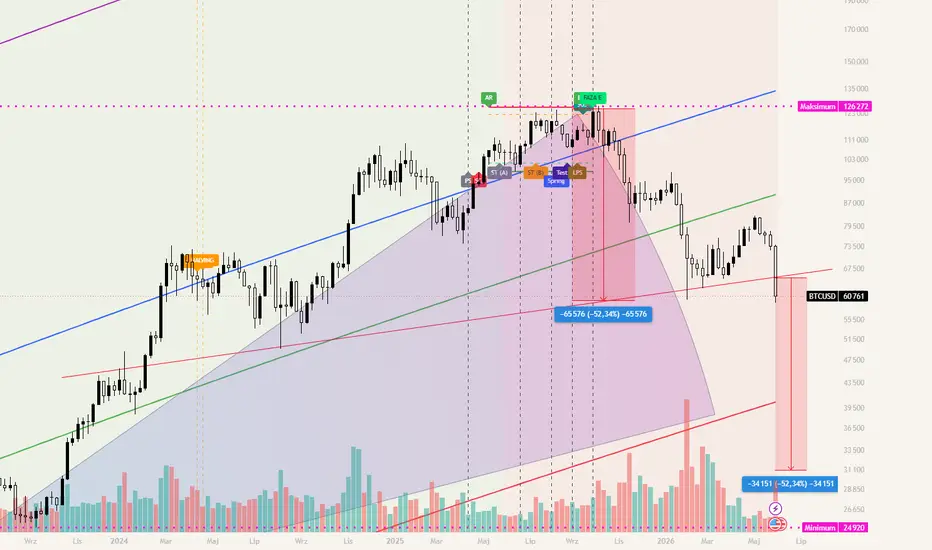
An advanced Bitcoin macro analysis tool on weekly (1W) and monthly (1M) time frames. The script automatically maps global BTC cycles by combining the Power-Law mathematical model, Halving cyclicality, and precise institutional market geometry according to Richard Wyckoff's methodology.
How does the indicator work? (Key Pillars)
1. Bitcoin Power-Law Model
The script calculates the time elapsed since the birth of the Bitcoin network (the so-called Genesis Block – January 3, 2009). Based on a logarithmic scale, it marks four fixed long-term trend lines:
- Blue Line (Fair Value): Shows Bitcoin's mathematical fair value, around which the market has been fluctuating for over a decade.
- Purple Line (Medium-Term Ceiling): Marks historical market overheating zones and bull market bubble peaks.
- Green Line (Price Floor): Key macro support level, marking the ultimate market bottom during the greatest capitulation.
- Red Line: A safety band running deep below the chart, constituting the ultimate boundary of the uptrend.
2. Halving Cycles (Halving Counter)
The indicator automatically locates past and future miner reward events on the timeline (including the upcoming Halving in April 2028). It plots vertical orange dashed lines with labels on the chart, allowing you to instantly assess which phase of the 4-year cycle the price is currently in.
3. Wyckoff Pattern Detection Macro (Post-Fact Drawing)
This indicator operates in a highly secure and conservative manner. It doesn't guess patterns in real time to avoid false signals during trends. Instead, it scans the market for flat consolidations (sideways ranges) only in extreme regions:
- Accumulation (Bear Bottoms): Searched only when the price is deep below the central axis (in the area of the green line).
- Distribution (Bull Tops): Searched only when the price is high above the central axis (in the area of the 2024-2025 highs).
Trigger Moment: When the market is building a sideways trend and the price officially crosses the 10-period moving average (SMA 10) (an upside breakout for accumulation or a downside breakdown for distribution), the algorithm validates the structure. In this split second, the script moves back on the chart for the designated period and plots the complete Wyckoff Anatomy using the spread: It draws automatic, horizontal support and resistance lines of the trading range (Trading Range).
It sets vertical black lines dividing the structure into official market sub-phases. It marks precise turning points:
- institutional capital: PS/PSY (Initial Support/Resistance),
- SC/BC (Selling/Buying Climax),
- AR (Automatic Rebound),
- ST (Secondary Test),
- Spring/UTAD (Clearing Liquidity Lows/Highs),
- LPS/LPSY (Last Support/Resistance Points)
- and PHASE E – the moment of releasing a new, powerful macro trend.
User Manual Interval:
The indicator was designed and calibrated exclusively for high time frames: 1 Week (1W) or 1 Month (1M).
Logarithmic Scale: In order for the Power-Law lines and labels to perfectly match the Bitcoin price chart and not "float" when scrolling the screen, you must have the logarithmic scale enabled on the TradingView chart (click the Log button in the lower right corner of the screen).
Application: The tool is used to identify global turning points (wealth generation) – it allows you to buy Bitcoin in Phase E of macro accumulation and safely implement profits as Phase E distribution heralds the arrival of a bear market.
How does the indicator work? (Key Pillars)
1. Bitcoin Power-Law Model
The script calculates the time elapsed since the birth of the Bitcoin network (the so-called Genesis Block – January 3, 2009). Based on a logarithmic scale, it marks four fixed long-term trend lines:
- Blue Line (Fair Value): Shows Bitcoin's mathematical fair value, around which the market has been fluctuating for over a decade.
- Purple Line (Medium-Term Ceiling): Marks historical market overheating zones and bull market bubble peaks.
- Green Line (Price Floor): Key macro support level, marking the ultimate market bottom during the greatest capitulation.
- Red Line: A safety band running deep below the chart, constituting the ultimate boundary of the uptrend.
2. Halving Cycles (Halving Counter)
The indicator automatically locates past and future miner reward events on the timeline (including the upcoming Halving in April 2028). It plots vertical orange dashed lines with labels on the chart, allowing you to instantly assess which phase of the 4-year cycle the price is currently in.
3. Wyckoff Pattern Detection Macro (Post-Fact Drawing)
This indicator operates in a highly secure and conservative manner. It doesn't guess patterns in real time to avoid false signals during trends. Instead, it scans the market for flat consolidations (sideways ranges) only in extreme regions:
- Accumulation (Bear Bottoms): Searched only when the price is deep below the central axis (in the area of the green line).
- Distribution (Bull Tops): Searched only when the price is high above the central axis (in the area of the 2024-2025 highs).
Trigger Moment: When the market is building a sideways trend and the price officially crosses the 10-period moving average (SMA 10) (an upside breakout for accumulation or a downside breakdown for distribution), the algorithm validates the structure. In this split second, the script moves back on the chart for the designated period and plots the complete Wyckoff Anatomy using the spread: It draws automatic, horizontal support and resistance lines of the trading range (Trading Range).
It sets vertical black lines dividing the structure into official market sub-phases. It marks precise turning points:
- institutional capital: PS/PSY (Initial Support/Resistance),
- SC/BC (Selling/Buying Climax),
- AR (Automatic Rebound),
- ST (Secondary Test),
- Spring/UTAD (Clearing Liquidity Lows/Highs),
- LPS/LPSY (Last Support/Resistance Points)
- and PHASE E – the moment of releasing a new, powerful macro trend.
User Manual Interval:
The indicator was designed and calibrated exclusively for high time frames: 1 Week (1W) or 1 Month (1M).
Logarithmic Scale: In order for the Power-Law lines and labels to perfectly match the Bitcoin price chart and not "float" when scrolling the screen, you must have the logarithmic scale enabled on the TradingView chart (click the Log button in the lower right corner of the screen).
Application: The tool is used to identify global turning points (wealth generation) – it allows you to buy Bitcoin in Phase E of macro accumulation and safely implement profits as Phase E distribution heralds the arrival of a bear market.
Mã nguồn mở
Theo đúng tinh thần TradingView, tác giả của tập lệnh này đã công bố nó dưới dạng mã nguồn mở, để các nhà giao dịch có thể xem xét và xác minh chức năng. Chúc mừng tác giả! Mặc dù bạn có thể sử dụng miễn phí, hãy nhớ rằng việc công bố lại mã phải tuân theo Nội quy.

The comfort zone pays you a salary. The risk zone pays dreams.
Thông báo miễn trừ trách nhiệm
Thông tin và các ấn phẩm này không nhằm mục đích, và không cấu thành, lời khuyên hoặc khuyến nghị về tài chính, đầu tư, giao dịch hay các loại khác do TradingView cung cấp hoặc xác nhận. Đọc thêm tại Điều khoản Sử dụng.
Mã nguồn mở
Theo đúng tinh thần TradingView, tác giả của tập lệnh này đã công bố nó dưới dạng mã nguồn mở, để các nhà giao dịch có thể xem xét và xác minh chức năng. Chúc mừng tác giả! Mặc dù bạn có thể sử dụng miễn phí, hãy nhớ rằng việc công bố lại mã phải tuân theo Nội quy.
The comfort zone pays you a salary. The risk zone pays dreams.
Thông báo miễn trừ trách nhiệm
Thông tin và các ấn phẩm này không nhằm mục đích, và không cấu thành, lời khuyên hoặc khuyến nghị về tài chính, đầu tư, giao dịch hay các loại khác do TradingView cung cấp hoặc xác nhận. Đọc thêm tại Điều khoản Sử dụng.