OPEN-SOURCE SCRIPT
Cập nhật HPDR Bands with projection
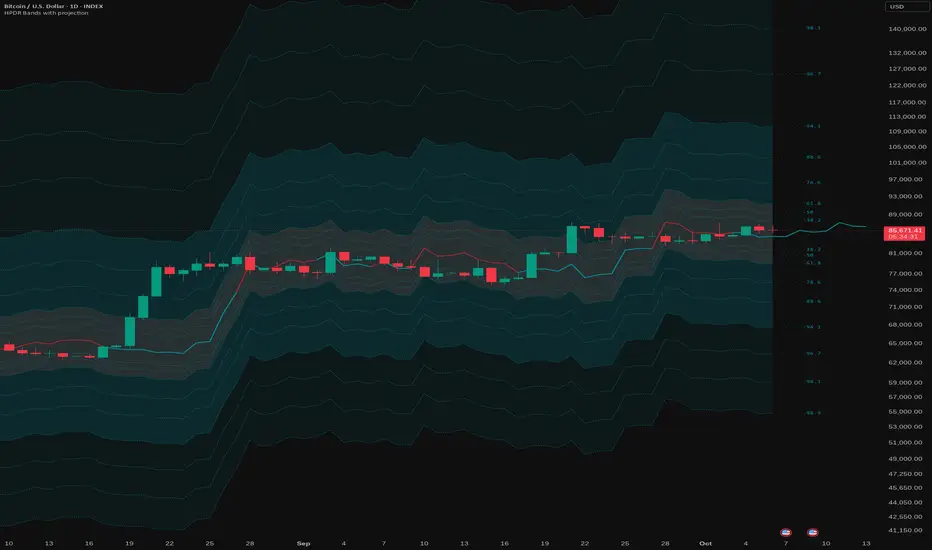
HPDR: Historical Price Delta Range
What is it? The HPDR indicator measures how much an asset’s price typically changes over a specific timeframe. It looks at historical price movements ("deltas") and organizes them into percentiles. These are then plotted on your chart as a median line surrounded by statistical bands.
This tool helps you understand an asset’s unique character and its typical price deviations.
Because the median is in this context a statistically relative stable value(if you add 7 values to 1000 it doesn't change much), it allows for high-probability projections of the future median.
For a clearer understanding of the indicator's logic, try setting the Range to 7 and the Offset to -7.
The 50% percentile Band signifies that in 50% of all bars, the price remained within this statistical range.
Phát hành các Ghi chú
- Rolling Window – Improved and streamlined historical data handling
- Color Scheme – Updated colors with better compatibility for both light and dark themes
- Code Optimization – Simplified and optimized the calculation and overall code structure
Phát hành các Ghi chú
better previewPhát hành các Ghi chú
better previewMã nguồn mở
Theo đúng tinh thần TradingView, tác giả của tập lệnh này đã công bố nó dưới dạng mã nguồn mở, để các nhà giao dịch có thể xem xét và xác minh chức năng. Chúc mừng tác giả! Mặc dù bạn có thể sử dụng miễn phí, hãy nhớ rằng việc công bố lại mã phải tuân theo Nội quy.

Thông báo miễn trừ trách nhiệm
Thông tin và các ấn phẩm này không nhằm mục đích, và không cấu thành, lời khuyên hoặc khuyến nghị về tài chính, đầu tư, giao dịch hay các loại khác do TradingView cung cấp hoặc xác nhận. Đọc thêm tại Điều khoản Sử dụng.
Mã nguồn mở
Theo đúng tinh thần TradingView, tác giả của tập lệnh này đã công bố nó dưới dạng mã nguồn mở, để các nhà giao dịch có thể xem xét và xác minh chức năng. Chúc mừng tác giả! Mặc dù bạn có thể sử dụng miễn phí, hãy nhớ rằng việc công bố lại mã phải tuân theo Nội quy.
Thông báo miễn trừ trách nhiệm
Thông tin và các ấn phẩm này không nhằm mục đích, và không cấu thành, lời khuyên hoặc khuyến nghị về tài chính, đầu tư, giao dịch hay các loại khác do TradingView cung cấp hoặc xác nhận. Đọc thêm tại Điều khoản Sử dụng.