HTF Fractals
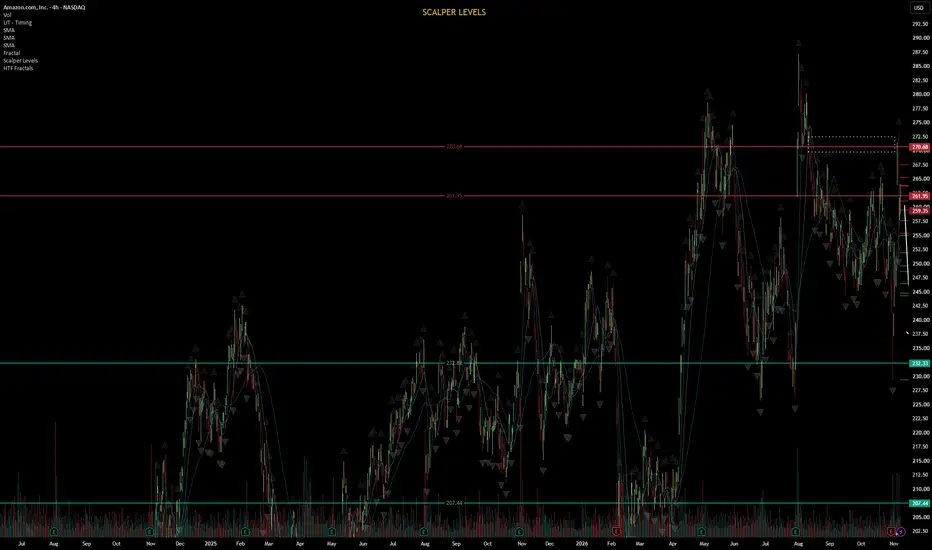
HTF Fractals
Displays Higher Timeframe (HTF) Williams Fractals directly on your lower timeframe chart as clean horizontal lines.
Features:
Plots confirmed fractal highs and lows from any higher timeframe (Daily, 4H, 1H, etc.)
Adjustable fractal strength — control how many bars are required on each side (classic Williams = 2)
Limits the number of levels shown to keep the chart clean
Fully customizable colors, line width, and whether lines extend to the right
Non-repainting on historical data
How to use:
Set your desired Higher Timeframe in the settings
Adjust “Bars each side” to control fractal sensitivity
The most recent HTF fractal highs (red) and lows (green) will appear as horizontal levels on your chart
Useful for identifying higher timeframe support/resistance and key swing points while trading on lower timeframes.
Displays Higher Timeframe (HTF) Williams Fractals directly on your lower timeframe chart as clean horizontal lines.
Features:
Plots confirmed fractal highs and lows from any higher timeframe (Daily, 4H, 1H, etc.)
Adjustable fractal strength — control how many bars are required on each side (classic Williams = 2)
Limits the number of levels shown to keep the chart clean
Fully customizable colors, line width, and whether lines extend to the right
Non-repainting on historical data
How to use:
Set your desired Higher Timeframe in the settings
Adjust “Bars each side” to control fractal sensitivity
The most recent HTF fractal highs (red) and lows (green) will appear as horizontal levels on your chart
Useful for identifying higher timeframe support/resistance and key swing points while trading on lower timeframes.

Thông báo miễn trừ trách nhiệm
Thông tin và các ấn phẩm này không nhằm mục đích, và không cấu thành, lời khuyên hoặc khuyến nghị về tài chính, đầu tư, giao dịch hay các loại khác do TradingView cung cấp hoặc xác nhận. Đọc thêm tại Điều khoản Sử dụng.
Thông báo miễn trừ trách nhiệm
Thông tin và các ấn phẩm này không nhằm mục đích, và không cấu thành, lời khuyên hoặc khuyến nghị về tài chính, đầu tư, giao dịch hay các loại khác do TradingView cung cấp hoặc xác nhận. Đọc thêm tại Điều khoản Sử dụng.