OPEN-SOURCE SCRIPT
Cập nhật Key Levels Zone v1.5
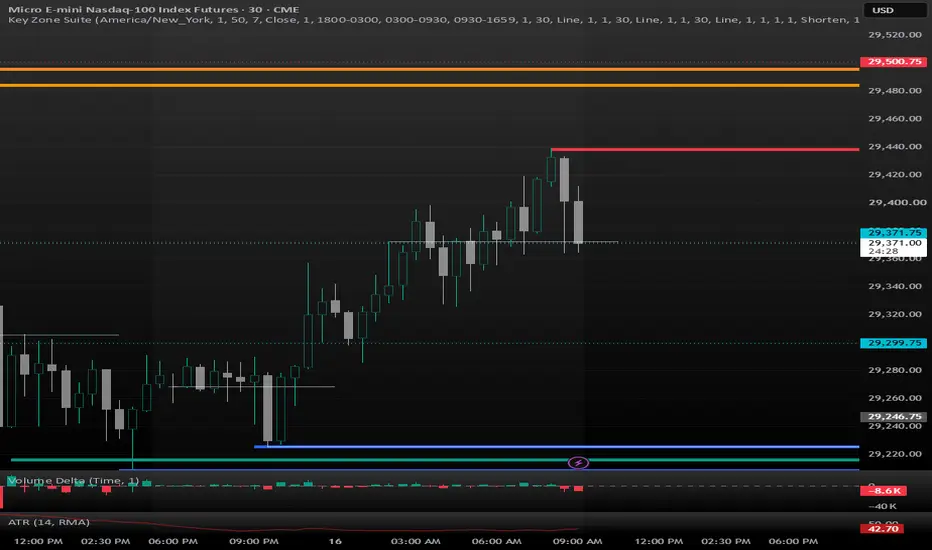
KEY LEVEL ZONE SUITE v1.5
The Key Level Zone Suite is a multi-timeframe market-structure indicator designed to organize important price levels into customizable zones instead of single horizontal lines.
The indicator combines session levels, daily reference levels, supply and demand, repeated-touch support and resistance, and confirmed swing points in one clean system. Every category can be independently enabled, customized, limited, and managed after price breaks through it.
Its purpose is to help traders identify areas where price may react, reject, consolidate, break, or reverse—while reducing chart clutter on lower timeframes.
FEATURES
SESSION OPEN ZONES
The indicator can display the exact opening prices of:
• Asia
• London
• New York
Each opening price is expanded into an adjustable zone. Opening prices are calculated using internal 1-minute data, helping maintain accurate session opens when the indicator is viewed on higher-timeframe charts.
Each session-open zone includes independent controls for:
• Visibility
• Session time
• Zone thickness in ticks
• Horizontal projection length
• Fill and border colors
• Maximum number of zones
• Text visibility
• Broken-zone behavior
Session-open zones are disabled by default but can be enabled individually.
SESSION HIGH AND LOW ZONES
The indicator can display completed high and low zones from the:
• Asia session
• London session
• New York session
For each session, traders can choose:
• Today
• Yesterday
• Both
Today’s high and low are added only after the selected session finishes. This prevents a developing session range from being mistaken for a finalized level.
Older session ranges are automatically cleared, preventing multiple days of session highs and lows from accumulating across the chart.
DAILY AND WEEKLY KEY LEVELS
The indicator includes:
• Daily Open
• Previous-Day High
• Previous-Day Low
• Previous Monday High
• Previous Monday Low
The Daily Open is calculated from the customizable trading-day session. By default, it uses the futures-style trading day beginning at 6:00 PM New York time.
Only the two newest Daily Open zones are retained, representing the current trading day and the previous trading day.
Previous-Day High and Low zones can be enabled when needed, with an adjustable number of previous-day sets.
The Monday levels represent the completed high and low from the latest Monday. Only the newest Monday pair is retained, so older Monday zones do not fill the chart.
SUPPLY AND DEMAND ZONES
Supply and demand zones are created from confirmed pivot points that produce a required move away from the area.
A supply zone requires:
• A confirmed pivot high
• A bearish move away from the pivot
• A move meeting the selected ATR-strength requirement
A demand zone requires:
• A confirmed pivot low
• A bullish move away from the pivot
• A move meeting the selected ATR-strength requirement
Supply and demand have their own calculation timeframe. This allows a trader to display zones from one selected timeframe while changing the chart timeframe.
For example, supply and demand can remain calculated from the 2-hour chart while the trader moves down to a 5-minute, 2-minute, or 1-minute execution chart.
Adjustable settings include:
• Calculation timeframe
• Pivot strength
• ATR length
• Required ATR move away
• Zone thickness
• Projection length
• Supply and demand colors
• Maximum supply zones
• Maximum demand zones
• Broken-zone behavior
• Text visibility
The default profile displays a maximum of four supply zones and four demand zones.
SUPPORT AND RESISTANCE ZONES
Support and resistance zones are created from repeated confirmed pivots near the same price.
A zone is displayed only after the required number of touches occurs within the selected tick tolerance.
Resistance is formed from matching pivot highs, while support is formed from matching pivot lows.
Adjustable settings include:
• Independent calculation timeframe
• Pivot bars to the left and right
• Minimum number of touches
• Matching tolerance in ticks
• Zone thickness
• Projection length
• Maximum support and resistance zones
• Colors and transparency
• Broken-zone behavior
• Text visibility
Because support and resistance use an independent source timeframe, their zones remain consistent when changing chart timeframes.
SWING-HIGH AND SWING-LOW ZONES
Confirmed swing highs and swing lows can also be displayed as zones.
These levels use adjustable pivot confirmation and an independent calculation timeframe.
Swing zones are disabled by default to keep the starting chart clean. They can be enabled when a trader wants additional market-structure levels.
MULTI-TIMEFRAME ZONES
Supply and demand, support and resistance, and swing zones each have independent calculation timeframes.
The selected source timeframe controls where the zone is created—not the current chart timeframe.
For example:
• Set supply and demand to 120 minutes
• Set support and resistance to 2 minutes
• View the chart on 1, 2, 5, or 15 minutes
The supply and demand zones will continue to represent the 2-hour structure, while support and resistance will continue to represent the 2-minute structure.
For multi-timeframe structural zones, projection length is measured using bars from the selected calculation timeframe.
ZONE-BREAK CONFIRMATION
A zone can be considered broken using either:
• Close
• Wick
Close mode waits for a candle to close beyond the zone and break buffer. This is the more conservative setting and helps prevent a temporary wick from invalidating a zone.
Wick mode considers the zone broken when the candle’s high or low crosses completely through the zone and buffer.
An adjustable break buffer, measured in ticks, can help prevent small overshoots or liquidity sweeps from immediately invalidating a level.
BROKEN-ZONE OPTIONS
Every category includes independent behavior for zones that are broken:
DELETE
The zone is completely removed from the chart.
FREEZE
The zone stops extending at the candle that broke it and remains visible for review.
SHORTEN
The zone stops actively extending and keeps only the selected number of bars after the break.
For example, an active zone projecting 20 bars ahead can be shortened to 10 bars after it breaks.
KEEP
The zone stops actively updating but retains its existing endpoint.
Broken zones can also use a separate fill color so traders can distinguish invalidated levels from active zones.
ZONE RETENTION AND CHART CLEANUP
The indicator contains several controls designed to keep lower-timeframe charts organized:
• Adjustable calendar-day history
• Global maximum number of zones
• Independent limits for each structural category
• Only two Daily Opens retained
• Only the latest Monday High and Low retained
• Today, Yesterday, or Both session-range selection
• Independent text switches
• Automatic removal of older zones
The default history is seven calendar days.
When a structural category exceeds its selected maximum, the indicator removes broken zones first. If no broken zones remain, it removes the oldest active zone.
This helps preserve the newest and most relevant active areas.
ZONE TEXT CONTROLS
Zone labels can be controlled using:
• A master text switch
• Session-open text
• Session high/low text
• Daily and weekly level text
• Supply and demand text
• Support and resistance text
• Swing-zone text
Turning off the text does not remove the zones. It only hides their labels, allowing for a cleaner visual layout.
ALERTS
The indicator can generate an alert whenever an active zone is broken.
To use this feature:
1. Enable “Alert when a zone breaks” in the indicator settings.
2. Open TradingView’s alert window.
3. Select the Key Level Zone Suite.
4. Choose “Any alert() function call.”
5. Select the desired alert frequency and notification method.
HOW TO USE THE INDICATOR
1. SET THE CORRECT TIMEZONE AND SESSIONS
Begin by confirming the session timezone. The default is America/New_York.
The default session times are designed around futures trading:
• Asia: 6:00 PM–3:00 AM
• London: 3:00 AM–9:30 AM
• New York: 9:30 AM–4:59 PM
• Trading day: 6:00 PM–5:00 PM
Session behavior can vary by market, exchange, daylight-saving changes, and personal trading plan. Adjust these values when trading instruments that use different session schedules.
2. CHOOSE THE LEVELS YOU NEED
Avoid enabling every available zone at once.
A clean intraday setup can include:
• Asia High and Low
• London High and Low
• Yesterday’s New York High and Low
• Current and previous Daily Open
• Previous Monday High and Low
• Higher-timeframe supply and demand
• Lower-timeframe support and resistance
Swing zones and session opens can be added when the trading plan specifically uses them.
3. USE HIGHER-TIMEFRAME SUPPLY AND DEMAND FOR CONTEXT
The default supply and demand timeframe is 2 hours.
These zones can be used to identify broader areas where a significant reaction may occur. Traders can then move to a lower timeframe and look for entry confirmation inside or near the higher-timeframe zone.
Supply can act as a potential resistance area. Demand can act as a potential support area.
These areas should not automatically be treated as entry signals.
4. USE SESSION LEVELS FOR INTRADAY LIQUIDITY
Session highs and lows often represent important intraday liquidity areas.
Watch how price behaves when it approaches:
• Asia High or Low
• London High or Low
• Previous New York High or Low
• Daily Open
• Previous Monday High or Low
Price may reject the level, sweep beyond it and return, consolidate inside it, or break through it with momentum.
5. LOOK FOR CONFLUENCE
A zone becomes more meaningful when multiple independent factors appear near the same price.
Examples include:
• London Low overlapping a demand zone
• Asia High overlapping resistance
• Daily Open inside a support zone
• Previous Monday High near supply
• A session liquidity sweep followed by a market-structure shift
Overlapping zones do not guarantee a trade, but they can help identify areas that deserve closer attention.
6. WAIT FOR PRICE CONFIRMATION
The indicator identifies areas of interest; it does not produce automatic buy or sell signals.
Possible confirmation can include:
• Strong rejection candle
• Hammer or shooting-star formation
• Engulfing candle
• Liquidity sweep and close back inside the zone
• Break of structure
• Change of character
• Increase in volume
• Delta shift
• Retest after a confirmed breakout
Entering only because price touches a zone can expose the trader to levels that are being broken rather than respected.
7. PLACE RISK OUTSIDE THE ZONE
When using a zone for an entry, the invalidation point is commonly placed beyond the opposite side of the zone with an additional tick buffer.
The exact stop distance should account for:
• Instrument volatility
• Zone thickness
• Current ATR
• Session conditions
• The trader’s maximum allowed risk
A wider zone requires different risk management than a narrow zone.
8. USE THE NEXT OPPOSING ZONE AS A REFERENCE
Potential targets can be based on the next opposing area.
For a long setup, possible references include:
• Resistance
• Supply
• Session High
• Previous-Day High
• Previous Monday High
For a short setup, possible references include:
• Support
• Demand
• Session Low
• Previous-Day Low
• Previous Monday Low
Always confirm that the available distance supports the minimum risk-to-reward ratio required by the trading plan.
DEFAULT SETUP
The included default profile is designed to provide useful structure without displaying every possible level.
The main defaults include:
• Seven calendar days of history
• Maximum of 50 total zones
• Close-based break confirmation
• One-tick break buffer
• Session opening zones disabled
• Asia High and Low set to Today
• London High and Low set to Today
• New York High and Low set to Yesterday
• Daily Open enabled
• Previous-Day High and Low disabled
• Previous Monday High and Low enabled
• Supply and demand enabled on the 2-hour timeframe
• Maximum of four supply and four demand zones
• Support and resistance enabled on the 2-minute timeframe
• Maximum of two support and two resistance zones
• Swing zones disabled
• Supply, demand, support, resistance, and swing text hidden
IMPORTANT NOTES
Confirmed pivot-based zones require bars to the right of the pivot. This means supply, demand, support, resistance, and swing zones appear only after their pivot conditions have been confirmed.
Session highs and lows appear after their session finishes because the final high and low cannot be known while the session is still active.
The indicator is best used as a mapping and confluence tool alongside price action, market structure, volume, and disciplined risk management.
No zone guarantees a reversal. Strong momentum can break through any level, and a broken zone does not automatically confirm that price will continue in the same direction.
This indicator is intended for educational and analytical purposes only. It does not provide financial advice or guarantee future trading performance.
The Key Level Zone Suite is a multi-timeframe market-structure indicator designed to organize important price levels into customizable zones instead of single horizontal lines.
The indicator combines session levels, daily reference levels, supply and demand, repeated-touch support and resistance, and confirmed swing points in one clean system. Every category can be independently enabled, customized, limited, and managed after price breaks through it.
Its purpose is to help traders identify areas where price may react, reject, consolidate, break, or reverse—while reducing chart clutter on lower timeframes.
FEATURES
SESSION OPEN ZONES
The indicator can display the exact opening prices of:
• Asia
• London
• New York
Each opening price is expanded into an adjustable zone. Opening prices are calculated using internal 1-minute data, helping maintain accurate session opens when the indicator is viewed on higher-timeframe charts.
Each session-open zone includes independent controls for:
• Visibility
• Session time
• Zone thickness in ticks
• Horizontal projection length
• Fill and border colors
• Maximum number of zones
• Text visibility
• Broken-zone behavior
Session-open zones are disabled by default but can be enabled individually.
SESSION HIGH AND LOW ZONES
The indicator can display completed high and low zones from the:
• Asia session
• London session
• New York session
For each session, traders can choose:
• Today
• Yesterday
• Both
Today’s high and low are added only after the selected session finishes. This prevents a developing session range from being mistaken for a finalized level.
Older session ranges are automatically cleared, preventing multiple days of session highs and lows from accumulating across the chart.
DAILY AND WEEKLY KEY LEVELS
The indicator includes:
• Daily Open
• Previous-Day High
• Previous-Day Low
• Previous Monday High
• Previous Monday Low
The Daily Open is calculated from the customizable trading-day session. By default, it uses the futures-style trading day beginning at 6:00 PM New York time.
Only the two newest Daily Open zones are retained, representing the current trading day and the previous trading day.
Previous-Day High and Low zones can be enabled when needed, with an adjustable number of previous-day sets.
The Monday levels represent the completed high and low from the latest Monday. Only the newest Monday pair is retained, so older Monday zones do not fill the chart.
SUPPLY AND DEMAND ZONES
Supply and demand zones are created from confirmed pivot points that produce a required move away from the area.
A supply zone requires:
• A confirmed pivot high
• A bearish move away from the pivot
• A move meeting the selected ATR-strength requirement
A demand zone requires:
• A confirmed pivot low
• A bullish move away from the pivot
• A move meeting the selected ATR-strength requirement
Supply and demand have their own calculation timeframe. This allows a trader to display zones from one selected timeframe while changing the chart timeframe.
For example, supply and demand can remain calculated from the 2-hour chart while the trader moves down to a 5-minute, 2-minute, or 1-minute execution chart.
Adjustable settings include:
• Calculation timeframe
• Pivot strength
• ATR length
• Required ATR move away
• Zone thickness
• Projection length
• Supply and demand colors
• Maximum supply zones
• Maximum demand zones
• Broken-zone behavior
• Text visibility
The default profile displays a maximum of four supply zones and four demand zones.
SUPPORT AND RESISTANCE ZONES
Support and resistance zones are created from repeated confirmed pivots near the same price.
A zone is displayed only after the required number of touches occurs within the selected tick tolerance.
Resistance is formed from matching pivot highs, while support is formed from matching pivot lows.
Adjustable settings include:
• Independent calculation timeframe
• Pivot bars to the left and right
• Minimum number of touches
• Matching tolerance in ticks
• Zone thickness
• Projection length
• Maximum support and resistance zones
• Colors and transparency
• Broken-zone behavior
• Text visibility
Because support and resistance use an independent source timeframe, their zones remain consistent when changing chart timeframes.
SWING-HIGH AND SWING-LOW ZONES
Confirmed swing highs and swing lows can also be displayed as zones.
These levels use adjustable pivot confirmation and an independent calculation timeframe.
Swing zones are disabled by default to keep the starting chart clean. They can be enabled when a trader wants additional market-structure levels.
MULTI-TIMEFRAME ZONES
Supply and demand, support and resistance, and swing zones each have independent calculation timeframes.
The selected source timeframe controls where the zone is created—not the current chart timeframe.
For example:
• Set supply and demand to 120 minutes
• Set support and resistance to 2 minutes
• View the chart on 1, 2, 5, or 15 minutes
The supply and demand zones will continue to represent the 2-hour structure, while support and resistance will continue to represent the 2-minute structure.
For multi-timeframe structural zones, projection length is measured using bars from the selected calculation timeframe.
ZONE-BREAK CONFIRMATION
A zone can be considered broken using either:
• Close
• Wick
Close mode waits for a candle to close beyond the zone and break buffer. This is the more conservative setting and helps prevent a temporary wick from invalidating a zone.
Wick mode considers the zone broken when the candle’s high or low crosses completely through the zone and buffer.
An adjustable break buffer, measured in ticks, can help prevent small overshoots or liquidity sweeps from immediately invalidating a level.
BROKEN-ZONE OPTIONS
Every category includes independent behavior for zones that are broken:
DELETE
The zone is completely removed from the chart.
FREEZE
The zone stops extending at the candle that broke it and remains visible for review.
SHORTEN
The zone stops actively extending and keeps only the selected number of bars after the break.
For example, an active zone projecting 20 bars ahead can be shortened to 10 bars after it breaks.
KEEP
The zone stops actively updating but retains its existing endpoint.
Broken zones can also use a separate fill color so traders can distinguish invalidated levels from active zones.
ZONE RETENTION AND CHART CLEANUP
The indicator contains several controls designed to keep lower-timeframe charts organized:
• Adjustable calendar-day history
• Global maximum number of zones
• Independent limits for each structural category
• Only two Daily Opens retained
• Only the latest Monday High and Low retained
• Today, Yesterday, or Both session-range selection
• Independent text switches
• Automatic removal of older zones
The default history is seven calendar days.
When a structural category exceeds its selected maximum, the indicator removes broken zones first. If no broken zones remain, it removes the oldest active zone.
This helps preserve the newest and most relevant active areas.
ZONE TEXT CONTROLS
Zone labels can be controlled using:
• A master text switch
• Session-open text
• Session high/low text
• Daily and weekly level text
• Supply and demand text
• Support and resistance text
• Swing-zone text
Turning off the text does not remove the zones. It only hides their labels, allowing for a cleaner visual layout.
ALERTS
The indicator can generate an alert whenever an active zone is broken.
To use this feature:
1. Enable “Alert when a zone breaks” in the indicator settings.
2. Open TradingView’s alert window.
3. Select the Key Level Zone Suite.
4. Choose “Any alert() function call.”
5. Select the desired alert frequency and notification method.
HOW TO USE THE INDICATOR
1. SET THE CORRECT TIMEZONE AND SESSIONS
Begin by confirming the session timezone. The default is America/New_York.
The default session times are designed around futures trading:
• Asia: 6:00 PM–3:00 AM
• London: 3:00 AM–9:30 AM
• New York: 9:30 AM–4:59 PM
• Trading day: 6:00 PM–5:00 PM
Session behavior can vary by market, exchange, daylight-saving changes, and personal trading plan. Adjust these values when trading instruments that use different session schedules.
2. CHOOSE THE LEVELS YOU NEED
Avoid enabling every available zone at once.
A clean intraday setup can include:
• Asia High and Low
• London High and Low
• Yesterday’s New York High and Low
• Current and previous Daily Open
• Previous Monday High and Low
• Higher-timeframe supply and demand
• Lower-timeframe support and resistance
Swing zones and session opens can be added when the trading plan specifically uses them.
3. USE HIGHER-TIMEFRAME SUPPLY AND DEMAND FOR CONTEXT
The default supply and demand timeframe is 2 hours.
These zones can be used to identify broader areas where a significant reaction may occur. Traders can then move to a lower timeframe and look for entry confirmation inside or near the higher-timeframe zone.
Supply can act as a potential resistance area. Demand can act as a potential support area.
These areas should not automatically be treated as entry signals.
4. USE SESSION LEVELS FOR INTRADAY LIQUIDITY
Session highs and lows often represent important intraday liquidity areas.
Watch how price behaves when it approaches:
• Asia High or Low
• London High or Low
• Previous New York High or Low
• Daily Open
• Previous Monday High or Low
Price may reject the level, sweep beyond it and return, consolidate inside it, or break through it with momentum.
5. LOOK FOR CONFLUENCE
A zone becomes more meaningful when multiple independent factors appear near the same price.
Examples include:
• London Low overlapping a demand zone
• Asia High overlapping resistance
• Daily Open inside a support zone
• Previous Monday High near supply
• A session liquidity sweep followed by a market-structure shift
Overlapping zones do not guarantee a trade, but they can help identify areas that deserve closer attention.
6. WAIT FOR PRICE CONFIRMATION
The indicator identifies areas of interest; it does not produce automatic buy or sell signals.
Possible confirmation can include:
• Strong rejection candle
• Hammer or shooting-star formation
• Engulfing candle
• Liquidity sweep and close back inside the zone
• Break of structure
• Change of character
• Increase in volume
• Delta shift
• Retest after a confirmed breakout
Entering only because price touches a zone can expose the trader to levels that are being broken rather than respected.
7. PLACE RISK OUTSIDE THE ZONE
When using a zone for an entry, the invalidation point is commonly placed beyond the opposite side of the zone with an additional tick buffer.
The exact stop distance should account for:
• Instrument volatility
• Zone thickness
• Current ATR
• Session conditions
• The trader’s maximum allowed risk
A wider zone requires different risk management than a narrow zone.
8. USE THE NEXT OPPOSING ZONE AS A REFERENCE
Potential targets can be based on the next opposing area.
For a long setup, possible references include:
• Resistance
• Supply
• Session High
• Previous-Day High
• Previous Monday High
For a short setup, possible references include:
• Support
• Demand
• Session Low
• Previous-Day Low
• Previous Monday Low
Always confirm that the available distance supports the minimum risk-to-reward ratio required by the trading plan.
DEFAULT SETUP
The included default profile is designed to provide useful structure without displaying every possible level.
The main defaults include:
• Seven calendar days of history
• Maximum of 50 total zones
• Close-based break confirmation
• One-tick break buffer
• Session opening zones disabled
• Asia High and Low set to Today
• London High and Low set to Today
• New York High and Low set to Yesterday
• Daily Open enabled
• Previous-Day High and Low disabled
• Previous Monday High and Low enabled
• Supply and demand enabled on the 2-hour timeframe
• Maximum of four supply and four demand zones
• Support and resistance enabled on the 2-minute timeframe
• Maximum of two support and two resistance zones
• Swing zones disabled
• Supply, demand, support, resistance, and swing text hidden
IMPORTANT NOTES
Confirmed pivot-based zones require bars to the right of the pivot. This means supply, demand, support, resistance, and swing zones appear only after their pivot conditions have been confirmed.
Session highs and lows appear after their session finishes because the final high and low cannot be known while the session is still active.
The indicator is best used as a mapping and confluence tool alongside price action, market structure, volume, and disciplined risk management.
No zone guarantees a reversal. Strong momentum can break through any level, and a broken zone does not automatically confirm that price will continue in the same direction.
This indicator is intended for educational and analytical purposes only. It does not provide financial advice or guarantee future trading performance.
Phát hành các Ghi chú
This update adds a volume POC to the zones, If the zone brightens up to max transparency it means that there is a Volume Profile POC in the zonePhát hành các Ghi chú
Fixed opening price zone fron not showing up on chartPhát hành các Ghi chú
Now you have the option to have the key levels as just a line to keep the chart cleaner or aa a zone more customization, and also fixed the placement of the text to the right of the zonePhát hành các Ghi chú
Fixed Runtime error RE10110,For users with a free trading view accountMã nguồn mở
Theo đúng tinh thần TradingView, tác giả của tập lệnh này đã công bố nó dưới dạng mã nguồn mở, để các nhà giao dịch có thể xem xét và xác minh chức năng. Chúc mừng tác giả! Mặc dù bạn có thể sử dụng miễn phí, hãy nhớ rằng việc công bố lại mã phải tuân theo Nội quy.

Thông báo miễn trừ trách nhiệm
Thông tin và các ấn phẩm này không nhằm mục đích, và không cấu thành, lời khuyên hoặc khuyến nghị về tài chính, đầu tư, giao dịch hay các loại khác do TradingView cung cấp hoặc xác nhận. Đọc thêm tại Điều khoản Sử dụng.
Mã nguồn mở
Theo đúng tinh thần TradingView, tác giả của tập lệnh này đã công bố nó dưới dạng mã nguồn mở, để các nhà giao dịch có thể xem xét và xác minh chức năng. Chúc mừng tác giả! Mặc dù bạn có thể sử dụng miễn phí, hãy nhớ rằng việc công bố lại mã phải tuân theo Nội quy.
Thông báo miễn trừ trách nhiệm
Thông tin và các ấn phẩm này không nhằm mục đích, và không cấu thành, lời khuyên hoặc khuyến nghị về tài chính, đầu tư, giao dịch hay các loại khác do TradingView cung cấp hoặc xác nhận. Đọc thêm tại Điều khoản Sử dụng.