OPEN-SOURCE SCRIPT
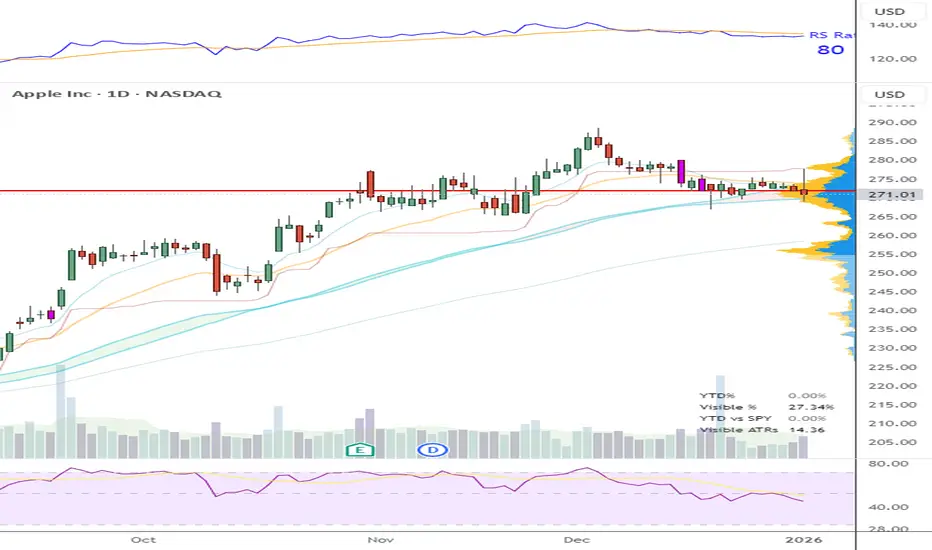
YTD % / Visible Range % Table
AUTHOR: Brandon Gum
DATE: 2026-01-03
// PURPOSE:
// Calculates price-range metrics based on the *currently visible*
// portion of the chart. Intended for table-based UI display where
// values must be stable and evaluated only on the last bar.
//
// Originally based on Jeff Sun's ADR price data table.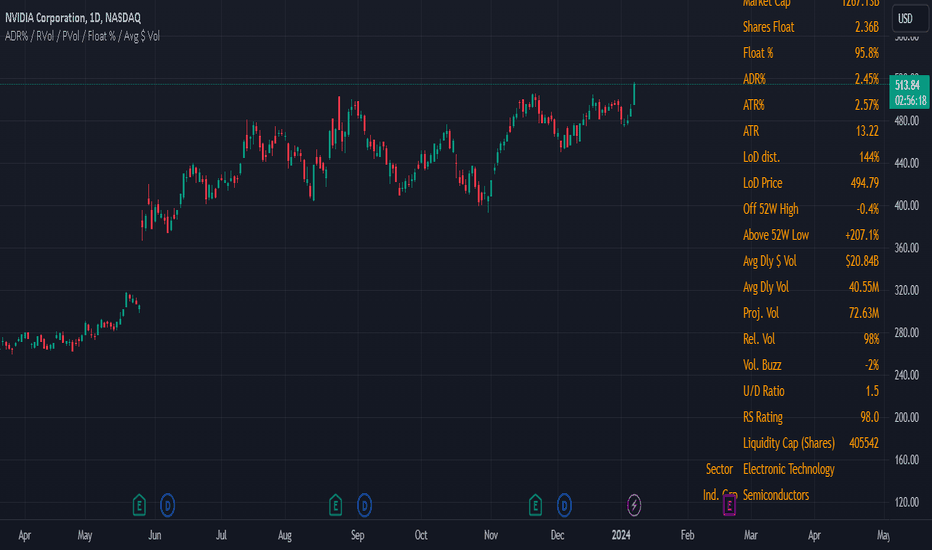
//
// METRICS RETURNED:
// - Visible High
// - Visible Low
// - Visible % Range = (Visible High - Visible Low) / Visible Low
// - Visible ATRs = (Visible High - Visible Low) / ATR
//
// IMPLEMENTATION NOTES:
// - Logic executes ONLY on barstate.islast to avoid state corruption.
// - Visible range is recomputed atomically using a backward loop
// bounded by chart.left_visible_bar_time.
// - Avoids var-based accumulation and bar-by-bar resets, which are
// unreliable when visible window changes.
// - ATR is evaluated at the current bar (not averaged over range).
//
// ASSUMPTIONS / LIMITATIONS:
// - Uses chart-visible time boundaries supplied by TradingView.
// - Loop upper bound must be sufficiently large to cover max
// expected visible bars.
// - Intended for display purposes, not signal generation.
//
// SIDE EFFECTS:
// - None. No plots, no drawings, no state persistence.
DATE: 2026-01-03
// PURPOSE:
// Calculates price-range metrics based on the *currently visible*
// portion of the chart. Intended for table-based UI display where
// values must be stable and evaluated only on the last bar.
//
// Originally based on Jeff Sun's ADR price data table.
//
// METRICS RETURNED:
// - Visible High
// - Visible Low
// - Visible % Range = (Visible High - Visible Low) / Visible Low
// - Visible ATRs = (Visible High - Visible Low) / ATR
//
// IMPLEMENTATION NOTES:
// - Logic executes ONLY on barstate.islast to avoid state corruption.
// - Visible range is recomputed atomically using a backward loop
// bounded by chart.left_visible_bar_time.
// - Avoids var-based accumulation and bar-by-bar resets, which are
// unreliable when visible window changes.
// - ATR is evaluated at the current bar (not averaged over range).
//
// ASSUMPTIONS / LIMITATIONS:
// - Uses chart-visible time boundaries supplied by TradingView.
// - Loop upper bound must be sufficiently large to cover max
// expected visible bars.
// - Intended for display purposes, not signal generation.
//
// SIDE EFFECTS:
// - None. No plots, no drawings, no state persistence.
Mã nguồn mở
Theo đúng tinh thần TradingView, tác giả của tập lệnh này đã công bố nó dưới dạng mã nguồn mở, để các nhà giao dịch có thể xem xét và xác minh chức năng. Chúc mừng tác giả! Mặc dù bạn có thể sử dụng miễn phí, hãy nhớ rằng việc công bố lại mã phải tuân theo Nội quy.

-If you find this idea interesting please leave a like
-Follow for more
-Comments are always welcomed and appreciated
-Follow for more
-Comments are always welcomed and appreciated
Thông báo miễn trừ trách nhiệm
Thông tin và các ấn phẩm này không nhằm mục đích, và không cấu thành, lời khuyên hoặc khuyến nghị về tài chính, đầu tư, giao dịch hay các loại khác do TradingView cung cấp hoặc xác nhận. Đọc thêm tại Điều khoản Sử dụng.
Mã nguồn mở
Theo đúng tinh thần TradingView, tác giả của tập lệnh này đã công bố nó dưới dạng mã nguồn mở, để các nhà giao dịch có thể xem xét và xác minh chức năng. Chúc mừng tác giả! Mặc dù bạn có thể sử dụng miễn phí, hãy nhớ rằng việc công bố lại mã phải tuân theo Nội quy.
-If you find this idea interesting please leave a like
-Follow for more
-Comments are always welcomed and appreciated
-Follow for more
-Comments are always welcomed and appreciated
Thông báo miễn trừ trách nhiệm
Thông tin và các ấn phẩm này không nhằm mục đích, và không cấu thành, lời khuyên hoặc khuyến nghị về tài chính, đầu tư, giao dịch hay các loại khác do TradingView cung cấp hoặc xác nhận. Đọc thêm tại Điều khoản Sử dụng.