OPEN-SOURCE SCRIPT
Market Risk Dashboard with Cheat Sheet
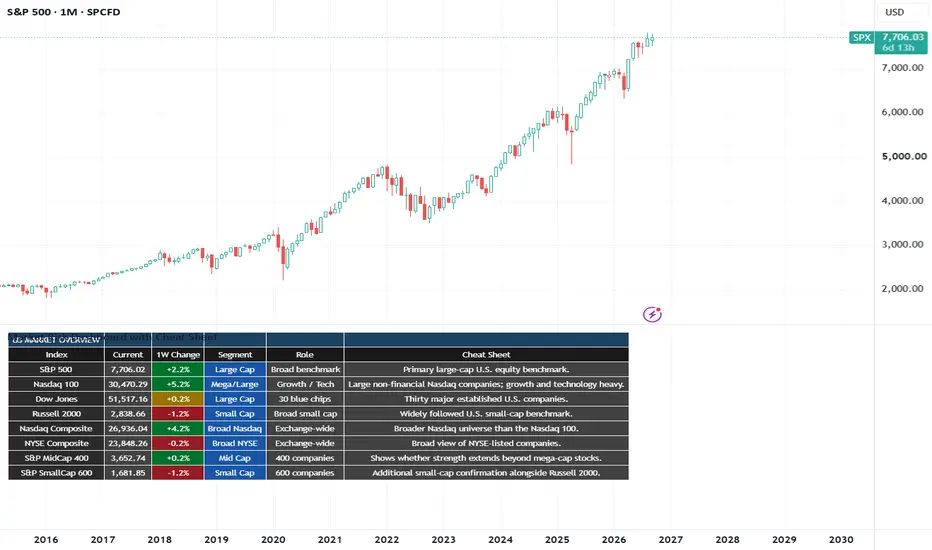
To help build a top down perspective of the God Markets necessary to identity Triangle breakouts and get the direction of the breakout correct on balance of probability you need to understand this because its the single biggest factor of your financial success regardless of which ever method you choose to use
You make your own luck which can be the output of a prepared mind that puts the work in, plus a little bit of destiny and manifestation. Reach out and follow for more insight and build the life you want for you and your family.
William Playfair was the inventor of charts, being the first documented person in our taught history to have the invention of charts attributed to him, bringing attending to this great person.
Market Internals, Macro & Cross-Asset Dashboard
This indicator is a multi-page market dashboard designed to help users understand what is happening underneath the headline price action.
Rather than relying on a single indicator, it combines equity breadth, major U.S. indices, volatility, Treasury yields, yield-curve structure, credit markets, commodities, the U.S. dollar and cross-asset relative performance.
The aim is to help answer questions such as:
Is an index rally supported by broad participation?
Are fewer stocks participating even though the headline index is rising?
Is an index statistically stretched?
Is volatility rising across equities or bonds?
Is the U.S. Treasury yield curve inverted, steepening or flattening?
Are credit markets confirming or contradicting equity strength?
Are commodities suggesting stronger cyclical demand or greater defensive positioning?
Which major asset classes are gaining or losing relative strength?
The indicator does not attempt to generate a single automatic Buy or Sell signal. It is intended as a market-analysis framework that lets the user compare several independent areas of the financial system.
Dashboard pages
The indicator is divided into pages to keep the information readable and to reduce TradingView data-request usage.
Overview shows the current level and one-week performance of major U.S. indices including the S&P 500, Nasdaq 100, Dow Jones, Russell 2000, Nasdaq Composite, NYSE Composite, S&P MidCap 400 and S&P SmallCap 600.
Equity Breadth examines how many stocks are participating in the market trend using the percentage of constituents above their 20-day, 50-day, 100-day and 200-day moving averages. It also compares current breadth with approximately one week earlier and highlights simple price/breadth divergences.
Index Trend shows each major index alongside its one-week return, 21-day Z-score, distance from its 30-week high and distance from its 200-week moving average.
Intraday Internals examines NYSE and Nasdaq TICK, Advance/Decline, volume breadth and TRIN. These are particularly useful during U.S. market hours.
Volatility tracks VIX, VXN, three-month VIX and MOVE, together with statistical extension and volatility term structure.
Bonds & Credit examines Treasury yields from 3 months through 30 years, yield-curve inversion, real yields, inflation expectations, credit spreads and bond-market relative strength.
Commodities tracks Gold, Silver, Copper, WTI, Brent, Natural Gas, a broad commodity index and the U.S. Dollar Index, together with several useful relative-value ratios.
Relative Performance compares equities, bonds, commodities, the dollar and Bitcoin over 1-week, 1-month, 3-month and 6-month periods.
Understanding the colours
Green generally means strengthening or improving.
Red generally means weakening, deterioration or greater market stress.
Yellow indicates a relatively neutral, flat or unchanged condition.
Orange highlights an elevated statistical condition or a divergence that deserves attention.
Blue is used mainly for reference measurements such as distance from a long-term high or moving average.
Grey represents neutral information or unavailable data.
The colours are intended to make large amounts of market information easier to read. They should not be interpreted as automatic trading signals.
Equity Breadth
Breadth asks a simple but important question:
How many stocks are actually participating in the market move?
An index can rise even when many of its underlying stocks are falling, particularly when a small number of very large companies dominate the index.
% above the 20-day moving average
A short-term breadth measure.
For example:
75%
means roughly 75% of the constituents represented by the breadth feed are trading above their 20-day moving averages.
A rising number means short-term participation is expanding.
A falling number means participation is narrowing.
If an index rises while its 20-day breadth falls, the advance may be becoming more concentrated.
% above the 50-day moving average
A useful intermediate breadth measure.
Above 50% means a majority of constituents are above their 50-day averages.
Below 50% means a majority are below them.
% above the 100-day moving average
Provides a medium-term view of participation.
Persistent deterioration may indicate that weakness is spreading beyond short-term fluctuations.
% above the 200-day moving average
A long-term breadth measure.
High readings mean a large part of the market remains in long-term uptrends.
A reading below 50% means fewer than half of the represented constituents are above their 200-day moving averages.
Weekly breadth change
The second number in a breadth cell shows how much the reading has changed from approximately one trading week earlier.
Example:
61%
-8 pts
means breadth is currently 61% and has fallen about eight percentage points from the previous week.
Price/Breadth Divergence
The dashboard can highlight:
PRICE UP / BREADTH DOWN
The index has risen while participation has weakened.
Or:
PRICE DOWN / BREADTH UP
The index has fallen while participation has improved.
A divergence is something to investigate. It is not automatically a reversal signal.
Z-Score
The 21-day Z-score measures how far the current price is from its recent average in units of standard deviation.
A positive value means price is above its recent average.
A negative value means price is below it.
As a rough guide:
-1 to +1 Relatively normal
+1 to +2 Elevated
+2 to +3 Stretched
Above +3 Unusually extended
-1 to -2 Elevated downside deviation
-2 to -3 Stretched downside
Below -3 Unusually extended
A high Z-score does not automatically mean an asset should fall.
A low Z-score does not automatically mean it should rise.
Strong trends can remain statistically extended for a considerable period.
The Z-score measures how unusual the current position is, not when a reversal must occur.
30-Week and 200-Week Measures
Distance from 30-week high
Shows how far the current value is below its highest level over approximately 30 weeks.
Example:
-3.5%
means the asset is about 3.5% below its 30-week high.
Distance from 200-week moving average
Shows the asset's position relative to a very long-term trend measure.
Positive means price is above the 200-week average.
Negative means it is below.
A large positive value can indicate strong long-term momentum, although it can also mean the asset is unusually far from its long-term trend.
Intraday Market Internals
These indicators are particularly useful during U.S. market hours.
TICK
Measures the number of stocks trading on an uptick minus those trading on a downtick.
Positive TICK means more stocks are ticking upward.
Negative TICK means more stocks are ticking downward.
Extreme readings can indicate unusually strong short-term buying or selling pressure.
ADD — Advance/Decline Difference
Measures advancing stocks minus declining stocks.
Positive means more stocks are advancing.
Negative means more stocks are declining.
If an index rises strongly while ADD remains weak, participation may be narrow.
VOLD
Measures advancing volume minus declining volume.
Positive means more volume is flowing through advancing stocks.
Negative means declining volume dominates.
TRIN — Arms Index
TRIN combines advancing and declining issues with their respective volume.
Around 1 is broadly balanced.
Above 1 generally indicates proportionally heavier volume in declining stocks.
Below 1 generally indicates relatively stronger volume in advancing stocks.
TRIN is best interpreted together with TICK, ADD and VOLD.
Volatility
VIX
Measures option-implied volatility for the S&P 500.
A rapidly rising VIX generally indicates increasing equity-market uncertainty or stress.
A falling VIX generally indicates declining expected volatility.
The change in VIX can sometimes be more informative than its absolute level.
VXN
The Nasdaq-100 volatility index.
Useful for comparing volatility in growth and technology stocks with the broader market.
VIX3M
Represents approximately three-month S&P 500 implied volatility.
Comparing VIX with VIX3M helps analyse volatility term structure.
VIX / VIX3M
Below 1 generally means short-term volatility is below three-month volatility.
Above 1 means short-dated volatility has moved above three-month volatility, which can occur during periods of near-term market stress.
MOVE
Measures implied volatility in the U.S. Treasury market.
It is sometimes described as the bond market's equivalent of VIX.
A sharp rise in MOVE indicates increasing uncertainty in interest rates and the Treasury market.
Treasury Yields and Yield Curve
The Bonds & Credit page tracks:
3-Month Treasury
2-Year Treasury
5-Year Treasury
10-Year Treasury
30-Year Treasury
This lets the dashboard examine the shape of the U.S. yield curve.
10Y − 3M
A widely followed curve spread.
If it is negative, the 3-month yield is above the 10-year yield.
10Y − 2Y
Another widely followed inversion measure.
Negative means the 2-year yield is above the 10-year yield.
30Y − 2Y
Compares a policy-sensitive shorter maturity with the long end of the Treasury curve.
30Y − 10Y
Shows the shape of the long end of the curve.
Curve status
The dashboard classifies each spread as:
INVERTED — the longer maturity yields less than the shorter maturity.
FLAT — the spread is positive but relatively small.
POSITIVE — the longer maturity yields more than the shorter maturity.
Inversion Direction
The dashboard also distinguishes whether an inversion is changing.
Example:
10Y - 2Y = -50 bp
If it was previously -80 bp, the inversion has become less negative.
The dashboard describes this as:
INVERTED / NORMALISING
If the spread moves from -20 bp to -50 bp, the inversion has become more pronounced:
INVERTED / DEEPENING
This distinction is important because simply knowing that the curve is inverted does not show how the curve is changing.
Bull and Bear Steepeners / Flatteners
The dashboard also attempts to classify the movement of key curve relationships.
Bull Steepener
Short-term yields fall faster than long-term yields.
The curve becomes steeper while yields are generally falling.
Bear Steepener
Long-term yields rise faster than short-term yields.
The curve becomes steeper while yields are generally rising.
Bull Flattener
Long-term yields fall faster than short-term yields.
The curve becomes flatter while rates are falling.
Bear Flattener
Short-term yields rise faster than long-term yields.
The curve becomes flatter while rates are rising.
These descriptions explain how the curve is moving, rather than declaring whether the move is good or bad for markets.
10-Year Real Yield
The real yield is the inflation-adjusted Treasury yield.
Rising real yields increase the real return available from bonds and raise the discount rate applied to financial assets.
They can be particularly relevant to:
growth equities
long-duration bonds
gold
other duration-sensitive assets
10-Year Breakeven Inflation
Represents the market-implied average inflation rate over approximately the next ten years.
Rising breakevens indicate increasing market-implied inflation expectations.
Falling breakevens indicate declining inflation expectations.
High-Yield Credit Spread
Measures the additional yield investors demand for holding lower-quality corporate credit instead of government bonds.
A widening spread means investors are demanding more compensation for credit risk.
A narrowing spread means credit risk is being priced more favourably.
Rapid widening can indicate increasing financial stress.
TLT, HYG and LQD
TLT
Represents long-duration U.S. Treasury bonds.
It generally moves inversely to long-term Treasury yields.
HYG
Represents high-yield corporate credit.
Strength can reflect healthy demand for riskier corporate debt.
Weakness can indicate deteriorating credit risk appetite.
LQD
Represents investment-grade corporate credit.
It generally carries lower credit risk than HYG.
HYG / LQD
Compares high-yield credit with investment-grade credit.
Rising means high-yield credit is outperforming.
Falling means investment-grade credit is outperforming relative to high-yield.
HYG / TLT
Compares risky corporate credit with long-duration government bonds.
Rising means credit is outperforming Treasuries.
Falling means Treasuries are gaining relative strength.
Commodities
Gold
Can respond to real yields, the U.S. dollar, inflation expectations, monetary demand and geopolitical risk.
Gold rising does not automatically mean markets are becoming defensive.
Context matters.
Silver
Has both precious-metal and industrial characteristics.
It often exhibits greater volatility than gold.
Copper
A major industrial metal often monitored as one indicator of global cyclical demand.
WTI and Brent Crude
Major U.S. and global oil benchmarks.
Large changes in oil prices can influence inflation expectations and economic conditions.
Natural Gas
Highly volatile and strongly affected by weather, inventories, production and LNG flows.
Broad Commodity Index
Helps determine whether commodity strength or weakness is widespread rather than isolated to one market.
U.S. Dollar Index — DXY
Tracks the U.S. dollar against a basket of major currencies.
A rising dollar can tighten global financial conditions and can influence commodities, emerging markets and international liquidity.
Relationships vary over time, so DXY should be interpreted alongside rates, commodities and risk assets.
Commodity Ratios
Copper / Gold
Rising means Copper is outperforming Gold.
This can be associated with stronger cyclical relative performance.
Falling means Gold is outperforming Copper.
Gold / Silver
Rising means Gold is outperforming Silver.
Falling means Silver is outperforming Gold.
WTI / Gold
Rising means Oil is outperforming Gold.
Falling means Gold is outperforming Oil.
These are relative-performance measures rather than standalone forecasts.
Cross-Asset Relative Performance
This page puts very different markets onto the same percentage-return basis.
It compares:
S&P 500
Nasdaq 100
Russell 2000
TLT
HYG
Gold
Copper
WTI
DXY
Bitcoin
Across:
1 week
1 month
3 months
6 months
This can make capital rotation much easier to identify.
For example:
S&P 500 +5%
Gold +12%
TLT -7%
Bitcoin +18%
immediately shows which assets have delivered the strongest and weakest performance over the selected period.
Interpreting Several Indicators Together
The dashboard is intended to be read as a network of evidence.
For example:
S&P 500 rising
Russell 2000 rising
20D breadth rising
50D breadth rising
HYG strong
Credit spreads stable
VIX falling
describes a market move with relatively broad confirmation.
Compare that with:
S&P 500 rising
Nasdaq rising
Russell falling
20D breadth falling
50D breadth falling
HYG weakening
VIX rising
The headline index may still be advancing, but several internal measures are moving in a different direction.
Similarly:
VIX rising
MOVE rising
Credit spreads widening
HYG weakening
Breadth deteriorating
shows several independent stress indicators worsening at the same time.
The combination is generally more informative than any single number.
Data Availability
Some market-internal, volatility, exchange and economic feeds can depend on TradingView data access and subscription level.
Where possible, the script uses defensive requests so that an unavailable feed displays:
N/A
rather than intentionally stopping the rest of the dashboard.
Different feeds also update at different frequencies.
For example, exchange-traded markets may update continuously during trading hours while some economic or Federal Reserve series update daily or less frequently.
Important Limitations
Breadth feeds are aggregate market series. The script does not manually request and calculate all 500 S&P 500 constituents.
Continuous futures contracts can be influenced by contract rolls.
A five-bar weekly comparison represents approximately five trading sessions rather than exactly seven calendar days.
Statistical extremes can persist.
Yield-curve inversion has historically been monitored as a macroeconomic indicator, but it does not provide precise timing for equity-market peaks, recessions or recoveries.
Correlations between asset classes also change over time.
The dashboard therefore focuses on showing the evidence clearly rather than turning every reading into a prediction.
Suggested workflow
A useful sequence is:
1. Overview — identify leadership between large caps, mid caps and small caps.
2. Equity Breadth — determine whether the index move is broadly supported.
3. Index Trend — check statistical extension and longer-term trend position.
4. Intraday Internals — during U.S. market hours, assess TICK, ADD, VOLD and TRIN.
5. Volatility — examine whether equity and bond-market volatility is increasing.
6. Bonds & Credit — examine Treasury yields, curve inversion, real rates and credit conditions.
7. Commodities — assess Gold, Copper, Oil, DXY and important ratios.
8. Relative Performance — identify which asset classes are actually leading across several horizons.
The central principle of the indicator is simple:
Do not rely on one number. Look for confirmation or contradiction between price, breadth, volatility, rates, credit, commodities and relative performance.
This dashboard is designed to make those relationships easier to see.
Mã nguồn mở
Theo đúng tinh thần TradingView, tác giả của tập lệnh này đã công bố nó dưới dạng mã nguồn mở, để các nhà giao dịch có thể xem xét và xác minh chức năng. Chúc mừng tác giả! Mặc dù bạn có thể sử dụng miễn phí, hãy nhớ rằng việc công bố lại mã phải tuân theo Nội quy.

Thông báo miễn trừ trách nhiệm
Thông tin và các ấn phẩm này không nhằm mục đích, và không cấu thành, lời khuyên hoặc khuyến nghị về tài chính, đầu tư, giao dịch hay các loại khác do TradingView cung cấp hoặc xác nhận. Đọc thêm tại Điều khoản Sử dụng.
Mã nguồn mở
Theo đúng tinh thần TradingView, tác giả của tập lệnh này đã công bố nó dưới dạng mã nguồn mở, để các nhà giao dịch có thể xem xét và xác minh chức năng. Chúc mừng tác giả! Mặc dù bạn có thể sử dụng miễn phí, hãy nhớ rằng việc công bố lại mã phải tuân theo Nội quy.
Thông báo miễn trừ trách nhiệm
Thông tin và các ấn phẩm này không nhằm mục đích, và không cấu thành, lời khuyên hoặc khuyến nghị về tài chính, đầu tư, giao dịch hay các loại khác do TradingView cung cấp hoặc xác nhận. Đọc thêm tại Điều khoản Sử dụng.