Parallax Regime Lattice [JOAT]
Parallax Regime Lattice [JOAT]
Introduction
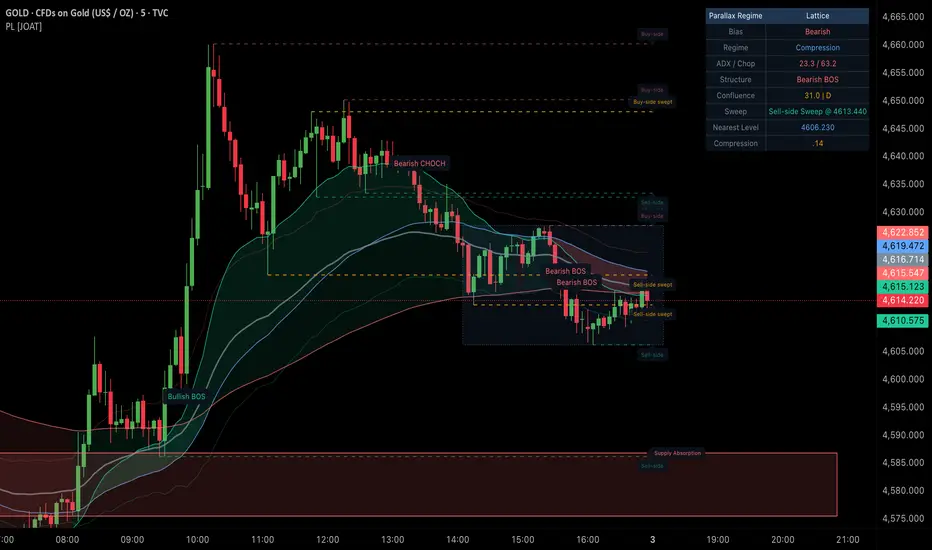
Parallax Regime Lattice is an open-source market-state overlay built to classify whether price is operating in directional expansion, transitional behavior, chop, or compression. It combines structure events, liquidity sweeps, absorption behavior, EMA alignment, ADX, and choppiness into one continuous regime and confluence model.
The problem Parallax solves is fragmented context. Structure, liquidity, and regime are often analyzed with separate scripts, which makes it difficult to see when they actually agree. Parallax consolidates those layers into one chart model so the user can evaluate bias, confluence, and nearby structural risk from a single panel.

Core Concepts
1. Structure State
The script tracks confirmed swing highs and swing lows and classifies directional breaks as the current structural state. This forms the backbone of the regime engine.
2. Liquidity Level Registry
Confirmed pivot highs and lows are registered as buy-side and sell-side liquidity references, extended forward, and marked when swept.
3. Absorption Zones
High-volume, low-body candles are used to identify localized demand or supply absorption areas, which are preserved as forward boxes for as long as they remain relevant.
4. Chop and Compression Filters
ADX, choppiness, and compression ratio work together to determine whether the market is expanding, compressing, or structurally noisy.
5. Confluence Score
Trend direction, structure, liquidity behavior, slope, and expansion quality are combined into one confluence score that is graded directly in the dashboard.
Features
How to Use This Indicator
Step 1: Read the regime row
Expansion means structure and conditions favor directional trade selection. Compression and chop mean the market is less suitable for trend continuation logic.
Step 2: Check confluence grade
The grade gives a compact summary of how strongly the active state is supported by the underlying engines.
Step 3: Use liquidity and absorption together
A sweep into an active absorption zone is a materially different event than an isolated sweep with no supporting structure.
Step 4: Use nearest level for risk framing
The nearest tracked structural level helps frame where the next meaningful invalidation or continuation event may occur.
Indicator Limitations
Originality Statement
Parallax Regime Lattice is original in the way it merges structure, liquidity, absorption, chop, compression, and confluence into one coherent regime overlay rather than presenting those layers as disconnected tools.
Disclaimer
This indicator is provided for educational and informational purposes only. It is not financial advice. Structural, liquidity, and regime readings can fail in live markets. Always apply independent risk management and validation.
Introduction
Parallax Regime Lattice is an open-source market-state overlay built to classify whether price is operating in directional expansion, transitional behavior, chop, or compression. It combines structure events, liquidity sweeps, absorption behavior, EMA alignment, ADX, and choppiness into one continuous regime and confluence model.
The problem Parallax solves is fragmented context. Structure, liquidity, and regime are often analyzed with separate scripts, which makes it difficult to see when they actually agree. Parallax consolidates those layers into one chart model so the user can evaluate bias, confluence, and nearby structural risk from a single panel.
Core Concepts
1. Structure State
The script tracks confirmed swing highs and swing lows and classifies directional breaks as the current structural state. This forms the backbone of the regime engine.
2. Liquidity Level Registry
Confirmed pivot highs and lows are registered as buy-side and sell-side liquidity references, extended forward, and marked when swept.
3. Absorption Zones
High-volume, low-body candles are used to identify localized demand or supply absorption areas, which are preserved as forward boxes for as long as they remain relevant.
4. Chop and Compression Filters
ADX, choppiness, and compression ratio work together to determine whether the market is expanding, compressing, or structurally noisy.
5. Confluence Score
Trend direction, structure, liquidity behavior, slope, and expansion quality are combined into one confluence score that is graded directly in the dashboard.
Features
- Structure classification: BOS and regime-state handling from confirmed swing breaks
- Liquidity sweep tracking: Buy-side and sell-side levels retained and marked when swept
- Absorption zones: High-volume low-body candles create forward supply or demand boxes
- Compression box: Compression is visualized directly on the chart when range conditions dominate
- Confluence heat: Optional background heat reflects directional agreement strength
- EMA ribbon: Fast, intermediate, and structural composites define directional geometry
- Institutional dashboard: Bias, regime, ADX/chop, structure, confluence, sweep status, nearest level, and compression are summarized in one panel
How to Use This Indicator
Step 1: Read the regime row
Expansion means structure and conditions favor directional trade selection. Compression and chop mean the market is less suitable for trend continuation logic.
Step 2: Check confluence grade
The grade gives a compact summary of how strongly the active state is supported by the underlying engines.
Step 3: Use liquidity and absorption together
A sweep into an active absorption zone is a materially different event than an isolated sweep with no supporting structure.
Step 4: Use nearest level for risk framing
The nearest tracked structural level helps frame where the next meaningful invalidation or continuation event may occur.
Indicator Limitations
- Swing-confirmed structure always arrives with intentional delay because pivots require confirmation
- Liquidity levels are contextual references, not guaranteed reversal points
- Compression and chop states can persist longer than expected in slow markets
- Parallax classifies regime and confluence; it is not a full execution model by itself
Originality Statement
Parallax Regime Lattice is original in the way it merges structure, liquidity, absorption, chop, compression, and confluence into one coherent regime overlay rather than presenting those layers as disconnected tools.
Disclaimer
This indicator is provided for educational and informational purposes only. It is not financial advice. Structural, liquidity, and regime readings can fail in live markets. Always apply independent risk management and validation.

The Institutional Grade Trading Ecosystem, Built to win trades 📈
Get Access 👇
jackofalltrades.vip 🌐
t.me/jackofalltradesvip 🃏
Get Access 👇
jackofalltrades.vip 🌐
t.me/jackofalltradesvip 🃏
Thông báo miễn trừ trách nhiệm
Thông tin và các ấn phẩm này không nhằm mục đích, và không cấu thành, lời khuyên hoặc khuyến nghị về tài chính, đầu tư, giao dịch hay các loại khác do TradingView cung cấp hoặc xác nhận. Đọc thêm tại Điều khoản Sử dụng.