OPEN-SOURCE SCRIPT
Monte Carlo Simulation Builder
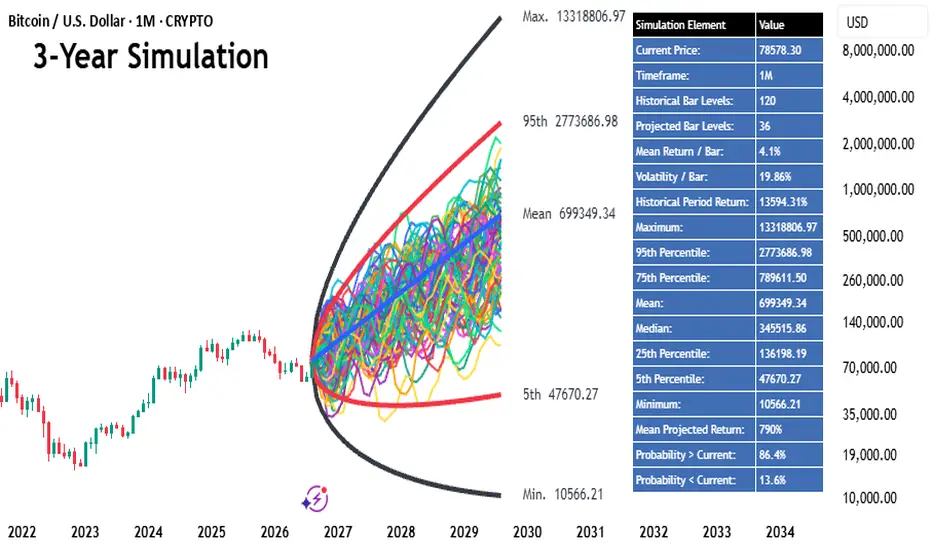
Monte Carlo Simulation Introduction:
Monte Carlo simulation in the context of financial markets is an economic forecasting model that combines stochastics and probability theory to predict potential future price moves. The simulation uses price data that is already available to generate various future price paths. Once the price paths are generated, a probability distribution produces an interval containing the simulated price paths between the minimum and maximum future price returns and defines a mean price return as the most likely expected future price at the point in time defined by the time period utilized in the simulation.
Step-by-Step Guide on Applying the Monte Carlo Simulation Builder:
1. Choose an underlying symbol and timeframe to simulate: Every symbol that operates with price bars can be simulated. However, for a sufficient simulation, there should be enough bars in the historical period. A stock that just had its IPO some hours or days ago may not have the necessary number of historical bars for a sufficient simulation.
2. Define the Historical Bar Levels and Projected Bar Levels: For every simulation, the Historical Bar Levels and Projected Bar Levels can be chosen. A smaller amount of Historical Bar Levels would be sufficient for short-term and local trends (choosing a smaller amount of Historical Bar Levels would not be ideal for a long-term simulation). A higher amount of Historical Bar Levels would be more sufficient for middle-to-longer term analysis (Example: A 3-year simulation could be based on 10-year Historical Bar Levels).
3. Define the Number of Simulations and Path/Curves Display: In the Monte Carlo Simulation Builder, the Number of Simulations defines how many simulations will be calculated. The Path Transparency regulates how transparent the paths will appear in the simulation. A lower Path Transparency will show the simulated price paths in a higher color density. The Path Width regulates how thick the statistical interval curves of the Monte Carlo Simulation will be displayed. The Statistical Curves displayed can also be modified, including which curves should be shown and how thick the curves should be displayed.
4. Run the Simulation: Once the simulation is played, the visualization of the simulation defines a practical range of the most likely outcomes of the future price action considered for the underlying asset and time period. The Statistical Curves help to define possible outcomes. For example, the minimum curve can be used to calculate the maximum drawdown for the underlying period. You can efficiently modify the simulations and see if a similar range results from different assumptions.
4-Chart Split Screen Demonstration With 4 Selected Monte Carlo Simulations:

The Statistical Element Results Explained:
Current Price: Price from which the historical returns are calculated and from which the Monte Carlo Simulation will project the future return paths and statistical curves.
Timeframe: Current timeframe perspective for which the indicator uses the historical and predictive bar amounts. (Examples: Monthly timeframe = monthly bars used in simulation, Weekly timeframe = weekly bars used in simulation).
Historical Bar Levels = The number of historical returns represented as bars that are entered in the Monte Carlo Simulation Builder tab.
Projected Bar Levels = The number of future returns represented as bars that are projected in the Monte Carlo Simulation chart price action beginning from the current price.
Mean Return / Bar = The average historical logarithmic returns for all of the bar returns of the historical bar time period (Example: Daily average return of the historical bar time period when a daily timeframe is set).
Volatility / Bar = The historical sample standard deviation of log returns for all bars of the historical time period (Example: Total sample standard deviation of the historical weekly bars when weekly historical bar levels are set).
Historical Period Return = The actual price return of the historical period beginning set by the Historical Bar levels till the current price bar.
Maximum = Highest possible upper price return outcome implied by the Monte Carlo Simulation.
95th percentile = Price below which, on average, 95% of the expected upcoming price action predicted by the Monte Carlo Simulation will lie.
75th percentile = Price below which, on average, 75% of the expected upcoming price action predicted by the Monte Carlo Simulation will lie.
Mean = The most likely expected upcoming average price according to the Monte Carlo Simulation.
Median = Half of the expected upcoming prices will lie on or below this value according to the Monte Carlo Simulation.
25th percentile = Price below which, on average, 25% of the expected upcoming price action predicted by the Monte Carlo Simulation will lie.
5th percentile = Price below which, on average, 5% of the expected upcoming price action predicted by the Monte Carlo Simulation will lie.
Minimum = Lowest possible lower price return outcome implied by the Monte Carlo Simulation.
Mean Projected Return = The expected percentage return from the current price to the most likely expected upcoming average price (mean).
Probability > Current = The probability that the upcoming price return implied by the Monte Carlo Simulation will be higher than the current price.
Probability < Current = The probability that the upcoming price return implied by the Monte Carlo Simulation will be lower than the current price.
Summary
The Monte Carlo Simulation Builder is an ideal indicator to simulate future price returns by analyzing historical price returns. It helps traders and investors predict future price scenarios and set up a trading strategy that considers maximum drawdowns, average returns, and the highest possible profits based on historical price returns. By considering the probability of higher or lower prices in the future in comparison to the current underlying symbol price, traders and investors can set up their trading or investing strategy around the potential probabilities.
Monte Carlo simulation in the context of financial markets is an economic forecasting model that combines stochastics and probability theory to predict potential future price moves. The simulation uses price data that is already available to generate various future price paths. Once the price paths are generated, a probability distribution produces an interval containing the simulated price paths between the minimum and maximum future price returns and defines a mean price return as the most likely expected future price at the point in time defined by the time period utilized in the simulation.
Step-by-Step Guide on Applying the Monte Carlo Simulation Builder:
1. Choose an underlying symbol and timeframe to simulate: Every symbol that operates with price bars can be simulated. However, for a sufficient simulation, there should be enough bars in the historical period. A stock that just had its IPO some hours or days ago may not have the necessary number of historical bars for a sufficient simulation.
2. Define the Historical Bar Levels and Projected Bar Levels: For every simulation, the Historical Bar Levels and Projected Bar Levels can be chosen. A smaller amount of Historical Bar Levels would be sufficient for short-term and local trends (choosing a smaller amount of Historical Bar Levels would not be ideal for a long-term simulation). A higher amount of Historical Bar Levels would be more sufficient for middle-to-longer term analysis (Example: A 3-year simulation could be based on 10-year Historical Bar Levels).
3. Define the Number of Simulations and Path/Curves Display: In the Monte Carlo Simulation Builder, the Number of Simulations defines how many simulations will be calculated. The Path Transparency regulates how transparent the paths will appear in the simulation. A lower Path Transparency will show the simulated price paths in a higher color density. The Path Width regulates how thick the statistical interval curves of the Monte Carlo Simulation will be displayed. The Statistical Curves displayed can also be modified, including which curves should be shown and how thick the curves should be displayed.
4. Run the Simulation: Once the simulation is played, the visualization of the simulation defines a practical range of the most likely outcomes of the future price action considered for the underlying asset and time period. The Statistical Curves help to define possible outcomes. For example, the minimum curve can be used to calculate the maximum drawdown for the underlying period. You can efficiently modify the simulations and see if a similar range results from different assumptions.
4-Chart Split Screen Demonstration With 4 Selected Monte Carlo Simulations:
The Statistical Element Results Explained:
Current Price: Price from which the historical returns are calculated and from which the Monte Carlo Simulation will project the future return paths and statistical curves.
Timeframe: Current timeframe perspective for which the indicator uses the historical and predictive bar amounts. (Examples: Monthly timeframe = monthly bars used in simulation, Weekly timeframe = weekly bars used in simulation).
Historical Bar Levels = The number of historical returns represented as bars that are entered in the Monte Carlo Simulation Builder tab.
Projected Bar Levels = The number of future returns represented as bars that are projected in the Monte Carlo Simulation chart price action beginning from the current price.
Mean Return / Bar = The average historical logarithmic returns for all of the bar returns of the historical bar time period (Example: Daily average return of the historical bar time period when a daily timeframe is set).
Volatility / Bar = The historical sample standard deviation of log returns for all bars of the historical time period (Example: Total sample standard deviation of the historical weekly bars when weekly historical bar levels are set).
Historical Period Return = The actual price return of the historical period beginning set by the Historical Bar levels till the current price bar.
Maximum = Highest possible upper price return outcome implied by the Monte Carlo Simulation.
95th percentile = Price below which, on average, 95% of the expected upcoming price action predicted by the Monte Carlo Simulation will lie.
75th percentile = Price below which, on average, 75% of the expected upcoming price action predicted by the Monte Carlo Simulation will lie.
Mean = The most likely expected upcoming average price according to the Monte Carlo Simulation.
Median = Half of the expected upcoming prices will lie on or below this value according to the Monte Carlo Simulation.
25th percentile = Price below which, on average, 25% of the expected upcoming price action predicted by the Monte Carlo Simulation will lie.
5th percentile = Price below which, on average, 5% of the expected upcoming price action predicted by the Monte Carlo Simulation will lie.
Minimum = Lowest possible lower price return outcome implied by the Monte Carlo Simulation.
Mean Projected Return = The expected percentage return from the current price to the most likely expected upcoming average price (mean).
Probability > Current = The probability that the upcoming price return implied by the Monte Carlo Simulation will be higher than the current price.
Probability < Current = The probability that the upcoming price return implied by the Monte Carlo Simulation will be lower than the current price.
Summary
The Monte Carlo Simulation Builder is an ideal indicator to simulate future price returns by analyzing historical price returns. It helps traders and investors predict future price scenarios and set up a trading strategy that considers maximum drawdowns, average returns, and the highest possible profits based on historical price returns. By considering the probability of higher or lower prices in the future in comparison to the current underlying symbol price, traders and investors can set up their trading or investing strategy around the potential probabilities.
Mã nguồn mở
Theo đúng tinh thần TradingView, tác giả của tập lệnh này đã công bố nó dưới dạng mã nguồn mở, để các nhà giao dịch có thể xem xét và xác minh chức năng. Chúc mừng tác giả! Mặc dù bạn có thể sử dụng miễn phí, hãy nhớ rằng việc công bố lại mã phải tuân theo Nội quy.

►✅JOIN THE BEST+ TOP TELEGRAM TRADING CHANNEL: t.me/VincePrinceForexGoldStocks
►🚀Join Premium Channels: bit.ly/4bUD8N8
►🔥JOIN BYBIT TOP EXCHANGE►🎁 UP TO $30,000 BONUS NOW: partner.bybit.com/b/VinceByBit
►🚀Join Premium Channels: bit.ly/4bUD8N8
►🔥JOIN BYBIT TOP EXCHANGE►🎁 UP TO $30,000 BONUS NOW: partner.bybit.com/b/VinceByBit
Thông báo miễn trừ trách nhiệm
Thông tin và các ấn phẩm này không nhằm mục đích, và không cấu thành, lời khuyên hoặc khuyến nghị về tài chính, đầu tư, giao dịch hay các loại khác do TradingView cung cấp hoặc xác nhận. Đọc thêm tại Điều khoản Sử dụng.
Mã nguồn mở
Theo đúng tinh thần TradingView, tác giả của tập lệnh này đã công bố nó dưới dạng mã nguồn mở, để các nhà giao dịch có thể xem xét và xác minh chức năng. Chúc mừng tác giả! Mặc dù bạn có thể sử dụng miễn phí, hãy nhớ rằng việc công bố lại mã phải tuân theo Nội quy.
►✅JOIN THE BEST+ TOP TELEGRAM TRADING CHANNEL: t.me/VincePrinceForexGoldStocks
►🚀Join Premium Channels: bit.ly/4bUD8N8
►🔥JOIN BYBIT TOP EXCHANGE►🎁 UP TO $30,000 BONUS NOW: partner.bybit.com/b/VinceByBit
►🚀Join Premium Channels: bit.ly/4bUD8N8
►🔥JOIN BYBIT TOP EXCHANGE►🎁 UP TO $30,000 BONUS NOW: partner.bybit.com/b/VinceByBit
Thông báo miễn trừ trách nhiệm
Thông tin và các ấn phẩm này không nhằm mục đích, và không cấu thành, lời khuyên hoặc khuyến nghị về tài chính, đầu tư, giao dịch hay các loại khác do TradingView cung cấp hoặc xác nhận. Đọc thêm tại Điều khoản Sử dụng.