OPEN-SOURCE SCRIPT
Cập nhật Hourly Inflection Levels/ pivot points
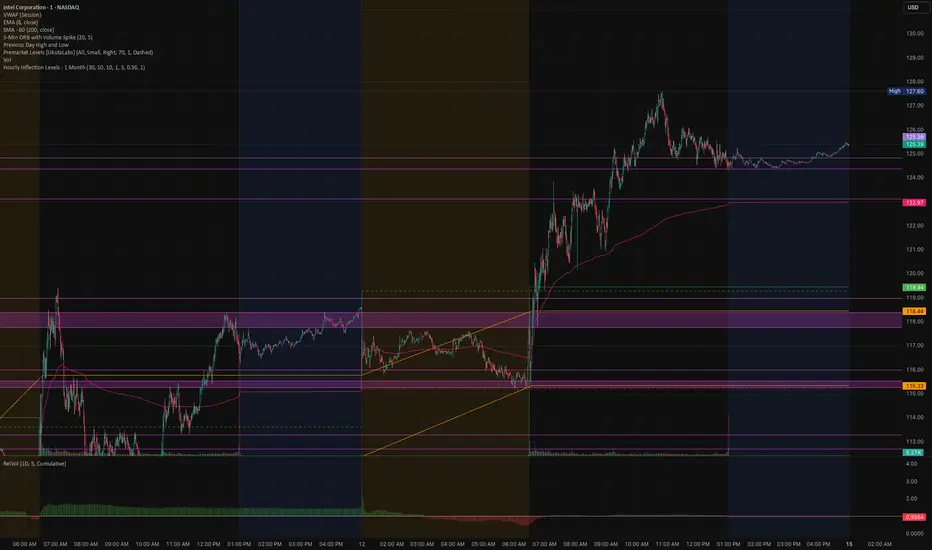
This indicator finds the price levels where the hourly chart has repeatedly turned, and draws them as support/resistance zones — regardless of what timeframe your chart is on. It pulls 1-hour data via request.security, so the same zones appear whether you're viewing a 5-minute, 1-hour, or 4-hour chart.
How it works
1. Pivot detection. On the hourly series it locates two kinds of turning points:
Wick pivots — pivot highs/lows based on candle high/low (where price actually reached).
Body pivots — pivot highs/lows based on max(open, close) / min(open, close) (where price closed the swing).
2. Intensity filter. Each pivot is scored by how far price travelled inside its pivot window (the displacement between the pivot and the opposite extreme). Weak, shallow pivots are discarded via the Min Inflection Intensity threshold, so only meaningful inflections survive.
3. Cross-type merging into zones. Every qualified pivot — wick or body, high or low — is pooled together, sorted by price, and merged: any pivots within the Merge / Zone Tolerance of each other collapse into a single zone. The zone's boundaries become the highest and lowest merged price; each merge adds one to the zone's touch count, and the zone keeps the strongest intensity of its members.
4. Display. Zones that have been touched at least Min Touch Count times are drawn as boxes, optionally extended to the right, with a label showing the level's mid-price, touch count, and intensity %. Levels touched fewer times are hidden.
Inputs
Lookback Period — how many days of hourly history to scan (rolling window; old levels are pruned automatically).
Pivot Left/Right Bars — sensitivity of pivot detection.
Min Touch Count — how many pivots must fall in a zone for it to be shown.
Min Inflection Intensity — minimum swing strength for a pivot to count.
Merge / Zone Tolerance — how close pivots must be to merge into one zone.
Wick / Body toggles — choose which pivot types feed the zones.
Display — extend zones right, show labels, zone color, border width.
Reading the zones
A zone with a high touch count and high intensity marks a price area the market has reacted to strongly and repeatedly over the past month — prime candidates for support, resistance, and reaction levels.
Note: Zones are confluence levels built from past hourly pivots, not signals. They don't repaint historically (pivots are confirmed), but the active set updates as new hourly bars form and old ones age out of the lookback window.
How it works
1. Pivot detection. On the hourly series it locates two kinds of turning points:
Wick pivots — pivot highs/lows based on candle high/low (where price actually reached).
Body pivots — pivot highs/lows based on max(open, close) / min(open, close) (where price closed the swing).
2. Intensity filter. Each pivot is scored by how far price travelled inside its pivot window (the displacement between the pivot and the opposite extreme). Weak, shallow pivots are discarded via the Min Inflection Intensity threshold, so only meaningful inflections survive.
3. Cross-type merging into zones. Every qualified pivot — wick or body, high or low — is pooled together, sorted by price, and merged: any pivots within the Merge / Zone Tolerance of each other collapse into a single zone. The zone's boundaries become the highest and lowest merged price; each merge adds one to the zone's touch count, and the zone keeps the strongest intensity of its members.
4. Display. Zones that have been touched at least Min Touch Count times are drawn as boxes, optionally extended to the right, with a label showing the level's mid-price, touch count, and intensity %. Levels touched fewer times are hidden.
Inputs
Lookback Period — how many days of hourly history to scan (rolling window; old levels are pruned automatically).
Pivot Left/Right Bars — sensitivity of pivot detection.
Min Touch Count — how many pivots must fall in a zone for it to be shown.
Min Inflection Intensity — minimum swing strength for a pivot to count.
Merge / Zone Tolerance — how close pivots must be to merge into one zone.
Wick / Body toggles — choose which pivot types feed the zones.
Display — extend zones right, show labels, zone color, border width.
Reading the zones
A zone with a high touch count and high intensity marks a price area the market has reacted to strongly and repeatedly over the past month — prime candidates for support, resistance, and reaction levels.
Note: Zones are confluence levels built from past hourly pivots, not signals. They don't repaint historically (pivots are confirmed), but the active set updates as new hourly bars form and old ones age out of the lookback window.
Phát hành các Ghi chú
This indicator finds the price levels where the hourly chart has repeatedly turned, and draws them as support/resistance zones — regardless of what timeframe your chart is on. It pulls 1-hour data via request.security, so the same zones appear whether you're viewing a 5-minute, 1-hour, or 4-hour chart.How it works
1. Pivot detection. On the hourly series it locates two kinds of turning points:
Wick pivots — pivot highs/lows based on candle high/low (where price actually reached).
Body pivots — pivot highs/lows based on max(open, close) / min(open, close) (where price closed the swing).
2. Intensity filter. Each pivot is scored by how far price travelled inside its pivot window (the displacement between the pivot and the opposite extreme). Weak, shallow pivots are discarded via the Min Inflection Intensity threshold, so only meaningful inflections survive.
3. Cross-type merging into zones. Every qualified pivot — wick or body, high or low — is pooled together, sorted by price, and merged: any pivots within the Merge / Zone Tolerance of each other collapse into a single zone. The zone's boundaries become the highest and lowest merged price; each merge adds one to the zone's touch count, and the zone keeps the strongest intensity of its members.
4. Display. Zones that have been touched at least Min Touch Count times are drawn as boxes, optionally extended to the right, with a label showing the level's mid-price, touch count, and intensity %. Levels touched fewer times are hidden.
Inputs
Lookback Period — how many days of hourly history to scan (rolling window; old levels are pruned automatically).
Pivot Left/Right Bars — sensitivity of pivot detection.
Min Touch Count — how many pivots must fall in a zone for it to be shown.
Min Inflection Intensity — minimum swing strength for a pivot to count.
Merge / Zone Tolerance — how close pivots must be to merge into one zone.
Wick / Body toggles — choose which pivot types feed the zones.
Display — extend zones right, show labels, zone color, border width.
Reading the zones
A zone with a high touch count and high intensity marks a price area the market has reacted to strongly and repeatedly over the past month — prime candidates for support, resistance, and reaction levels.
Note: Zones are confluence levels built from past hourly pivots, not signals. They don't repaint historically (pivots are confirmed), but the active set updates as new hourly bars form and old ones age out of the lookback window.
Phát hành các Ghi chú
Change include option to auto calcuate the intensity threshold based on ATR of a tickrMã nguồn mở
Theo đúng tinh thần TradingView, tác giả của tập lệnh này đã công bố nó dưới dạng mã nguồn mở, để các nhà giao dịch có thể xem xét và xác minh chức năng. Chúc mừng tác giả! Mặc dù bạn có thể sử dụng miễn phí, hãy nhớ rằng việc công bố lại mã phải tuân theo Nội quy.

Thông báo miễn trừ trách nhiệm
Thông tin và các ấn phẩm này không nhằm mục đích, và không cấu thành, lời khuyên hoặc khuyến nghị về tài chính, đầu tư, giao dịch hay các loại khác do TradingView cung cấp hoặc xác nhận. Đọc thêm tại Điều khoản Sử dụng.
Mã nguồn mở
Theo đúng tinh thần TradingView, tác giả của tập lệnh này đã công bố nó dưới dạng mã nguồn mở, để các nhà giao dịch có thể xem xét và xác minh chức năng. Chúc mừng tác giả! Mặc dù bạn có thể sử dụng miễn phí, hãy nhớ rằng việc công bố lại mã phải tuân theo Nội quy.
Thông báo miễn trừ trách nhiệm
Thông tin và các ấn phẩm này không nhằm mục đích, và không cấu thành, lời khuyên hoặc khuyến nghị về tài chính, đầu tư, giao dịch hay các loại khác do TradingView cung cấp hoặc xác nhận. Đọc thêm tại Điều khoản Sử dụng.