Cập nhật
Key Level Confluence [Indicatr]
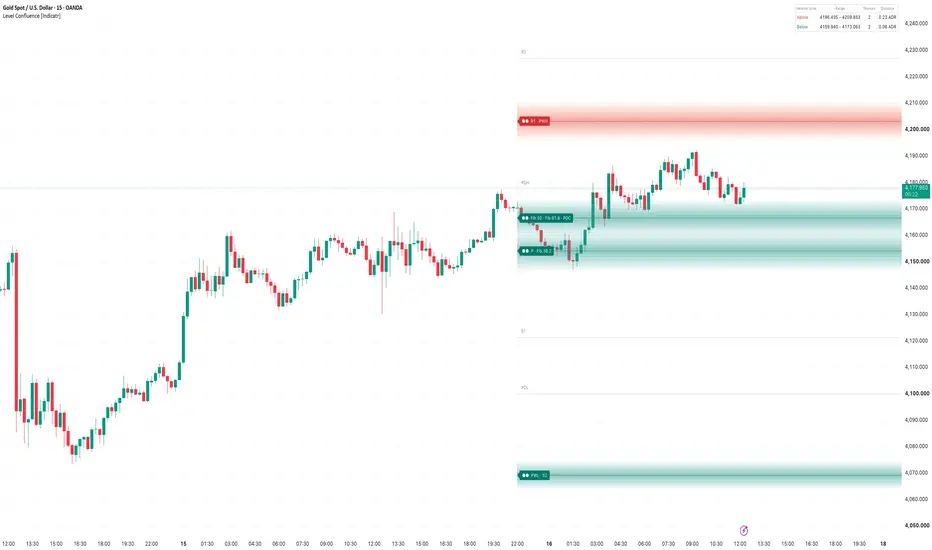
Key Level Confluence collects the levels most traders already watch - previous day and week highs and lows, the previous close, daily pivot points and the Fibonacci retracement of the last swing - and only highlights the prices where several of these independent sources meet. One level is a line. Two or three different levels at the same price are a zone.
WHAT IT DOES
Charts with every pivot, every previous high and every Fibonacci line quickly turn into noise. This script keeps the single levels in the background and draws gradient zones only where at least two different sources cluster. Zones above price are red, zones below price are green, and stronger zones (more sources) are drawn more intense. A table shows the nearest zone above and below, how many sources it contains and how far away it is.
HOW IT WORKS
HOW TO USE
THE CHART
Gold (XAUUSD) 15 minutes. A red zone above price where R1 and the previous week high meet, green zones below where the previous close, Fibonacci levels and the daily pivot cluster, and another green zone at the previous week low and S2. Single levels such as PDH, PDL, S1 and R2 stay as thin dotted lines. The table shows the nearest zone above and below with its distance in ADR.
WHAT IS ORIGINAL
Pivot, previous-period and Fibonacci tools exist separately. This script combines them, counts only distinct sources as confluence, normalises the zone width to the average daily range so it works on every intraday timeframe, and reduces the chart to the few prices where the levels actually overlap.
CREDITS
Pivot point formulas (Classic, Fibonacci, Camarilla) and Fibonacci retracements are standard public methods. Swings use the built-in ta.pivothigh and ta.pivotlow functions.
LIMITATIONS
Disclaimer
For educational and analytical purposes only. Not financial advice. Marks and signals are not buy or sell recommendations. Past behaviour does not guarantee future results.
WHAT IT DOES
Charts with every pivot, every previous high and every Fibonacci line quickly turn into noise. This script keeps the single levels in the background and draws gradient zones only where at least two different sources cluster. Zones above price are red, zones below price are green, and stronger zones (more sources) are drawn more intense. A table shows the nearest zone above and below, how many sources it contains and how far away it is.
HOW IT WORKS
- Levels: previous day high / low / close (intraday charts), previous week high / low, optional previous month high / low, daily pivot points (Classic, Fibonacci or Camarilla) and auto Fibonacci 38.2 / 50 / 61.8 of the last confirmed swing.
- No lookahead: previous period values are built from the chart's own bars when a new day, week or month starts - no request.security, nothing repaints into the past.
- Reference range: on intraday charts distances are measured in the average daily range (ADR) of the last 14 days, so zones keep the same width on 1 minute and on 4 hours. Daily and higher charts use the ATR.
- Clustering: levels are sorted by price and grouped when they lie within 0.12 x reference of each other.
- Distinct sources only: a zone needs at least two different sources (day, week, month, pivots, Fibonacci). Three Fibonacci ratios close to each other are not counted as confluence.
- Drawing: each zone is drawn as a gradient from a light edge to a deep core, starts at the beginning of the current day and extends to the right. The tag shows one dot per source and the names of all levels inside.
HOW TO USE
- Use the zones as areas where reactions are more likely to be watched by many participants - for long and short ideas alike.
- A red zone above price is a potential area for profit taking on longs or for short setups; a green zone below price works the other way round.
- Combine with your own entry trigger; the zones are context, not signals.
- Alerts: zone above touched, zone below touched, any zone touched.
THE CHART
Gold (XAUUSD) 15 minutes. A red zone above price where R1 and the previous week high meet, green zones below where the previous close, Fibonacci levels and the daily pivot cluster, and another green zone at the previous week low and S2. Single levels such as PDH, PDL, S1 and R2 stay as thin dotted lines. The table shows the nearest zone above and below with its distance in ADR.
WHAT IS ORIGINAL
Pivot, previous-period and Fibonacci tools exist separately. This script combines them, counts only distinct sources as confluence, normalises the zone width to the average daily range so it works on every intraday timeframe, and reduces the chart to the few prices where the levels actually overlap.
CREDITS
Pivot point formulas (Classic, Fibonacci, Camarilla) and Fibonacci retracements are standard public methods. Swings use the built-in ta.pivothigh and ta.pivotlow functions.
LIMITATIONS
- Daily levels depend on the session of the symbol (exchange time).
- The Fibonacci swing is confirmed after the swing length (default 20 bars), so it updates with a delay.
- Zones are drawn for the current day only and are recalculated when a new day starts.
Disclaimer
For educational and analytical purposes only. Not financial advice. Marks and signals are not buy or sell recommendations. Past behaviour does not guarantee future results.
Phát hành các Ghi chú
Updated chart snapshot (light theme) and added a tooltip for the single-level option. No changes to the calculation.Phát hành các Ghi chú
Fix: runtime error "historical offset beyond buffer limit" on charts with many bars per day (1 minute crypto, tick, range and seconds charts). Zones, level lines and tags are now anchored by time instead of bar index. Levels and calculation are unchanged.
Indicatr - the indicators you know, rebuilt with market context: volume, trend and momentum, for long and short. Free open-source tools and Pro tools. Guides and setups: indicator.trading/en/link
Thông báo miễn trừ trách nhiệm
Thông tin và các ấn phẩm này không nhằm mục đích, và không cấu thành, lời khuyên hoặc khuyến nghị về tài chính, đầu tư, giao dịch hay các loại khác do TradingView cung cấp hoặc xác nhận. Đọc thêm tại Điều khoản Sử dụng.
Indicatr - the indicators you know, rebuilt with market context: volume, trend and momentum, for long and short. Free open-source tools and Pro tools. Guides and setups: indicator.trading/en/link
Thông báo miễn trừ trách nhiệm
Thông tin và các ấn phẩm này không nhằm mục đích, và không cấu thành, lời khuyên hoặc khuyến nghị về tài chính, đầu tư, giao dịch hay các loại khác do TradingView cung cấp hoặc xác nhận. Đọc thêm tại Điều khoản Sử dụng.