OPEN-SOURCE SCRIPT
Cập nhật Stock Fundamental Performance:EPS and Revenue growth [Dots3Red]
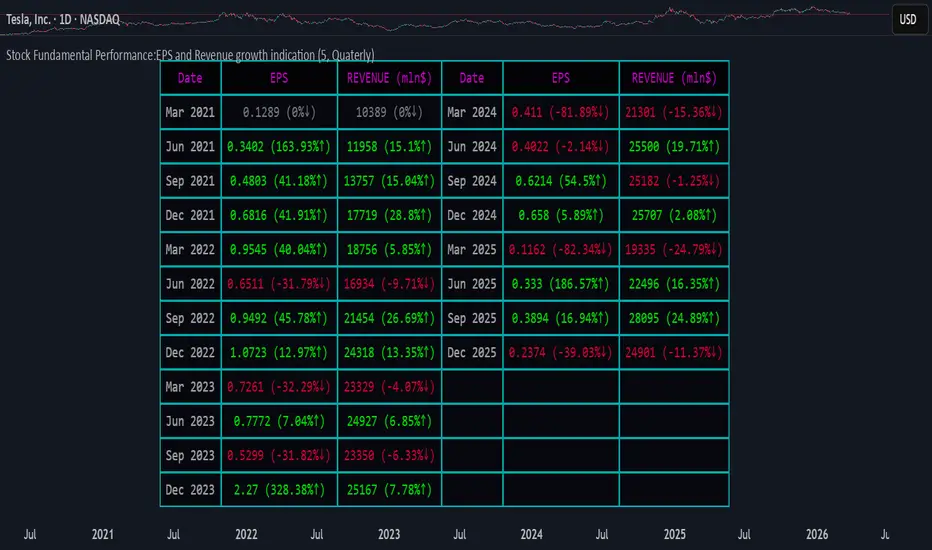
This indicator provides a clear and intuitive overview of a company’s revenue and EPS growth, helping you quickly evaluate its financial performance over time.
All data is displayed in a clean, easy-to-read table below the main chart, so you can analyze fundamentals without cluttering price action.
The indicator supports both annual and quarterly data, making it suitable for long-term investors and short-term traders alike.
In addition to raw values, it also shows the percentage change relative to the previous period, allowing you to instantly identify acceleration or deceleration in growth.
To improve visual clarity:
This color-coded system makes trend changes immediately visible at a glance.

How to use
By default, the table displays annual data for the last 5 years, offering a long-term perspective on company growth.
You can switch to quarterly data in the settings for a more granular analysis.
Limitations
Due to Pine Engine data request constraints, quarterly data is limited to a maximum lookback of 5 years.
Selecting a longer quarterly period may cause the data to appear out of chronological order. We are actively working on improvements to address this in future updates.
All data is displayed in a clean, easy-to-read table below the main chart, so you can analyze fundamentals without cluttering price action.
The indicator supports both annual and quarterly data, making it suitable for long-term investors and short-term traders alike.
In addition to raw values, it also shows the percentage change relative to the previous period, allowing you to instantly identify acceleration or deceleration in growth.
To improve visual clarity:
- Green values indicate an increase compared to the previous period
- Red values indicate a decrease compared to the previous period
This color-coded system makes trend changes immediately visible at a glance.
How to use
By default, the table displays annual data for the last 5 years, offering a long-term perspective on company growth.
You can switch to quarterly data in the settings for a more granular analysis.
Limitations
Due to Pine Engine data request constraints, quarterly data is limited to a maximum lookback of 5 years.
Selecting a longer quarterly period may cause the data to appear out of chronological order. We are actively working on improvements to address this in future updates.
Phát hành các Ghi chú
Updated the colour schemePhát hành các Ghi chú
Updated the colour schemeMã nguồn mở
Theo đúng tinh thần TradingView, tác giả của tập lệnh này đã công bố nó dưới dạng mã nguồn mở, để các nhà giao dịch có thể xem xét và xác minh chức năng. Chúc mừng tác giả! Mặc dù bạn có thể sử dụng miễn phí, hãy nhớ rằng việc công bố lại mã phải tuân theo Nội quy.

Connect the dots to elevate your trading.
Thông báo miễn trừ trách nhiệm
Thông tin và các ấn phẩm này không nhằm mục đích, và không cấu thành, lời khuyên hoặc khuyến nghị về tài chính, đầu tư, giao dịch hay các loại khác do TradingView cung cấp hoặc xác nhận. Đọc thêm tại Điều khoản Sử dụng.
Mã nguồn mở
Theo đúng tinh thần TradingView, tác giả của tập lệnh này đã công bố nó dưới dạng mã nguồn mở, để các nhà giao dịch có thể xem xét và xác minh chức năng. Chúc mừng tác giả! Mặc dù bạn có thể sử dụng miễn phí, hãy nhớ rằng việc công bố lại mã phải tuân theo Nội quy.
Connect the dots to elevate your trading.
Thông báo miễn trừ trách nhiệm
Thông tin và các ấn phẩm này không nhằm mục đích, và không cấu thành, lời khuyên hoặc khuyến nghị về tài chính, đầu tư, giao dịch hay các loại khác do TradingView cung cấp hoặc xác nhận. Đọc thêm tại Điều khoản Sử dụng.