OPEN-SOURCE SCRIPT
Vix FIX dots
Description
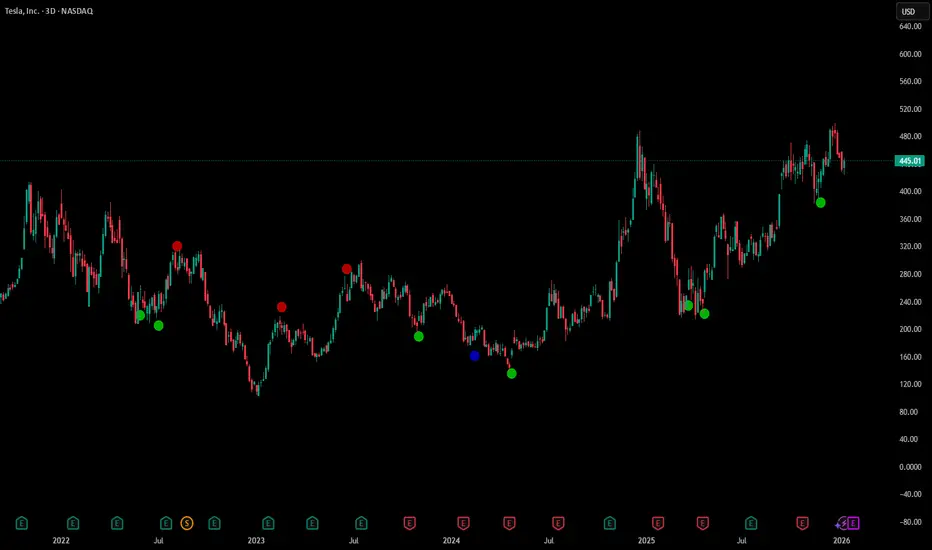
Vix FIX Dots is a momentum and volatility-based trend-following tool. It combines the classic Williams VIX Fix logic with Stochastic and RSI filters to identify high-probability reversal points and trend exhaustion.
Unlike the standard VIX Fix which is often displayed in a separate pane, this script overlays signals directly onto your chart as colorful dots to simplify the decision-making process.
How it Works
The script calculates the "Synthetic VIX" (Williams VIX Fix) to find market bottoms and volatility peaks. To reduce noise and false signals, it incorporates price action filters and trend-strength lookbacks.
Signal Guide
The indicator plots four distinct types of dots:
Green Circle (Below Bar): Filtered Long Entry. This represents a standard buy signal where volatility has peaked and price action confirms a move up.
Blue Circle (Below Bar): Aggressive Long Entry. A faster signal for traders looking to catch a move earlier, based on multi-candle lookbacks.
Red Circle (Above Bar): Filtered Exit/Short. Indicates a standard trend exhaustion point.
Orange Circle (Above Bar): Aggressive Exit/Short. A faster signal indicating the trend may be rolling over.
Key Features
Volatility Bands: Uses Bollinger Bands and Percentile calculations on the VIX Fix to identify extreme exhaustion.
Price Action Filter: Signals only trigger if the current close outperforms a user-defined number of previous bars.
Customizable Lookbacks: Fully adjustable settings for Stochastic and RSI filters to match your specific timeframe (M5, H1, D1, etc.).
Vix FIX Dots is a momentum and volatility-based trend-following tool. It combines the classic Williams VIX Fix logic with Stochastic and RSI filters to identify high-probability reversal points and trend exhaustion.
Unlike the standard VIX Fix which is often displayed in a separate pane, this script overlays signals directly onto your chart as colorful dots to simplify the decision-making process.
How it Works
The script calculates the "Synthetic VIX" (Williams VIX Fix) to find market bottoms and volatility peaks. To reduce noise and false signals, it incorporates price action filters and trend-strength lookbacks.
Signal Guide
The indicator plots four distinct types of dots:
Green Circle (Below Bar): Filtered Long Entry. This represents a standard buy signal where volatility has peaked and price action confirms a move up.
Blue Circle (Below Bar): Aggressive Long Entry. A faster signal for traders looking to catch a move earlier, based on multi-candle lookbacks.
Red Circle (Above Bar): Filtered Exit/Short. Indicates a standard trend exhaustion point.
Orange Circle (Above Bar): Aggressive Exit/Short. A faster signal indicating the trend may be rolling over.
Key Features
Volatility Bands: Uses Bollinger Bands and Percentile calculations on the VIX Fix to identify extreme exhaustion.
Price Action Filter: Signals only trigger if the current close outperforms a user-defined number of previous bars.
Customizable Lookbacks: Fully adjustable settings for Stochastic and RSI filters to match your specific timeframe (M5, H1, D1, etc.).
Mã nguồn mở
Theo đúng tinh thần TradingView, tác giả của tập lệnh này đã công bố nó dưới dạng mã nguồn mở, để các nhà giao dịch có thể xem xét và xác minh chức năng. Chúc mừng tác giả! Mặc dù bạn có thể sử dụng miễn phí, hãy nhớ rằng việc công bố lại mã phải tuân theo Nội quy.

Thông báo miễn trừ trách nhiệm
Thông tin và các ấn phẩm này không nhằm mục đích, và không cấu thành, lời khuyên hoặc khuyến nghị về tài chính, đầu tư, giao dịch hay các loại khác do TradingView cung cấp hoặc xác nhận. Đọc thêm tại Điều khoản Sử dụng.
Mã nguồn mở
Theo đúng tinh thần TradingView, tác giả của tập lệnh này đã công bố nó dưới dạng mã nguồn mở, để các nhà giao dịch có thể xem xét và xác minh chức năng. Chúc mừng tác giả! Mặc dù bạn có thể sử dụng miễn phí, hãy nhớ rằng việc công bố lại mã phải tuân theo Nội quy.
Thông báo miễn trừ trách nhiệm
Thông tin và các ấn phẩm này không nhằm mục đích, và không cấu thành, lời khuyên hoặc khuyến nghị về tài chính, đầu tư, giao dịch hay các loại khác do TradingView cung cấp hoặc xác nhận. Đọc thêm tại Điều khoản Sử dụng.