OPEN-SOURCE SCRIPT
Cập nhật Futrues Daily Pivot Zones
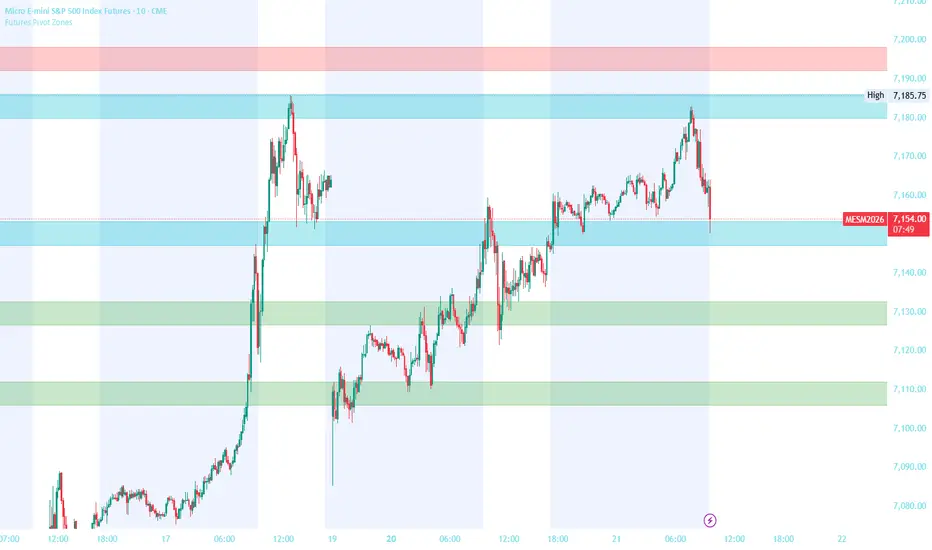
Automatically plots Daily Pivot Point levels as clean rectangle zones directly on your futures chart. Levels are calculated from the previous day's High, Low, and Close — the same levels watched by institutions, banks, and algorithms every single session.
Levels Included:
PP — Main Pivot Point (most watched level of the day)
R1, R2, R3 — Resistance zones above PP
S1, S2, S3 — Support zones below PP
PDH — Previous Day High
PDL — Previous Day Low
How To Use:
Look for price to reject or bounce off a zone in confluence with your EMA bias and VWAP direction. The more factors that agree at a zone — the stronger the trade.
Recommended Zone Buffer By Instrument:
MES (Micro E-Mini S&P 500) → 4.0 - 5.0 points
MNQ (Micro E-Mini Nasdaq) → 8.0 - 10.0 points
MGC (Micro Gold) → 15.0 - 20.0 points
MCL (Micro Crude Oil) → 0.15 - 0.25 points
M2K (Micro Russell 2000) → 3.0 - 4.0 points
Recommended Lookback:
750 bars on a 15-min chart covers approximately 3 trading days of price action.
Levels Included:
PP — Main Pivot Point (most watched level of the day)
R1, R2, R3 — Resistance zones above PP
S1, S2, S3 — Support zones below PP
PDH — Previous Day High
PDL — Previous Day Low
How To Use:
Look for price to reject or bounce off a zone in confluence with your EMA bias and VWAP direction. The more factors that agree at a zone — the stronger the trade.
Recommended Zone Buffer By Instrument:
MES (Micro E-Mini S&P 500) → 4.0 - 5.0 points
MNQ (Micro E-Mini Nasdaq) → 8.0 - 10.0 points
MGC (Micro Gold) → 15.0 - 20.0 points
MCL (Micro Crude Oil) → 0.15 - 0.25 points
M2K (Micro Russell 2000) → 3.0 - 4.0 points
Recommended Lookback:
750 bars on a 15-min chart covers approximately 3 trading days of price action.
Phát hành các Ghi chú
Automatically plots Daily Pivot Point levels as clean rectangle zones directly on your futures chart. Levels are calculated from the previous day's High, Low, and Close — the same levels watched by institutions, banks, and algorithms every single session.Levels Included:
PP — Main Pivot Point (most watched level of the day)
R1, R2, R3 — Resistance zones above PP
S1, S2, S3 — Support zones below PP
PDH — Previous Day High
PDL — Previous Day Low
How To Use:
Look for price to reject or bounce off a zone in confluence with your EMA bias and VWAP direction. The more factors that agree at a zone — the stronger the trade.
Recommended Zone Buffer By Instrument:
MES (Micro E-Mini S&P 500) → 4.0 - 5.0 points
MNQ (Micro E-Mini Nasdaq) → 8.0 - 10.0 points
MGC (Micro Gold) → 15.0 - 20.0 points
MCL (Micro Crude Oil) → 0.15 - 0.25 points
M2K (Micro Russell 2000) → 3.0 - 4.0 points
Recommended Lookback:
750 bars on a 15-min chart covers approximately 3 trading days of price action.
Phát hành các Ghi chú
updated colors and buffer and fixed spellingPhát hành các Ghi chú
fixed spelling and updated colors and bufferPhát hành các Ghi chú
updatedMã nguồn mở
Theo đúng tinh thần TradingView, tác giả của tập lệnh này đã công bố nó dưới dạng mã nguồn mở, để các nhà giao dịch có thể xem xét và xác minh chức năng. Chúc mừng tác giả! Mặc dù bạn có thể sử dụng miễn phí, hãy nhớ rằng việc công bố lại mã phải tuân theo Nội quy.

Thông báo miễn trừ trách nhiệm
Thông tin và các ấn phẩm này không nhằm mục đích, và không cấu thành, lời khuyên hoặc khuyến nghị về tài chính, đầu tư, giao dịch hay các loại khác do TradingView cung cấp hoặc xác nhận. Đọc thêm tại Điều khoản Sử dụng.
Mã nguồn mở
Theo đúng tinh thần TradingView, tác giả của tập lệnh này đã công bố nó dưới dạng mã nguồn mở, để các nhà giao dịch có thể xem xét và xác minh chức năng. Chúc mừng tác giả! Mặc dù bạn có thể sử dụng miễn phí, hãy nhớ rằng việc công bố lại mã phải tuân theo Nội quy.
Thông báo miễn trừ trách nhiệm
Thông tin và các ấn phẩm này không nhằm mục đích, và không cấu thành, lời khuyên hoặc khuyến nghị về tài chính, đầu tư, giao dịch hay các loại khác do TradingView cung cấp hoặc xác nhận. Đọc thêm tại Điều khoản Sử dụng.