OPEN-SOURCE SCRIPT
SMC Level Analyzer
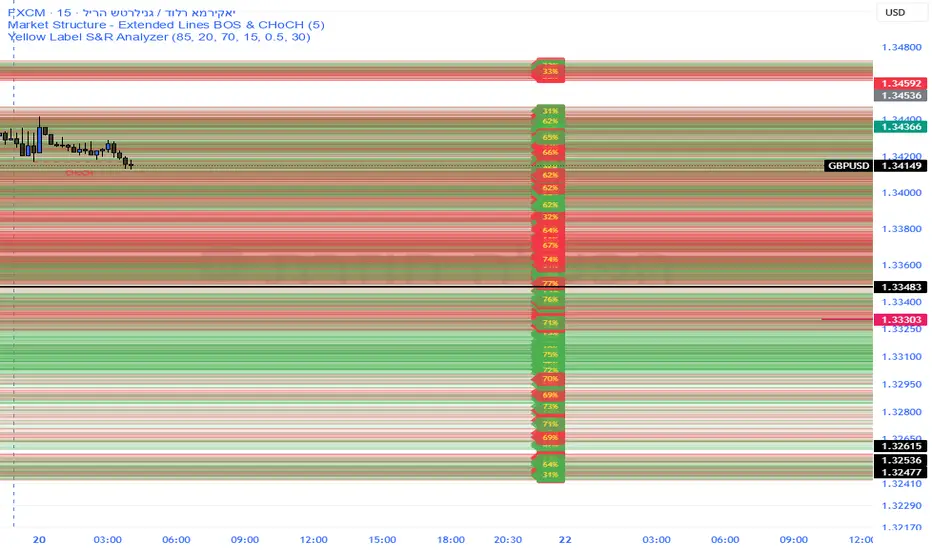
Precision S&R Strength – Indicator Description
Overview
The Precision S&R Strength analyzer is a sophisticated technical tool designed to identify and quantify the importance of Support and Resistance levels. Unlike standard pivot-point indicators, this script calculates a dynamic strength percentage for each level based on historical price interaction and accumulated trading volume.
Core Functionality
Smart Level Detection: Automatically identifies key high and low pivot points.
Volume & Touch Analysis: Each level is back-tested against the last 300 candles. The strength percentage (displayed on the right margin) is a weighted calculation of how many times the price reacted to the zone and the volume transacted at those prices.
Supply & Demand Zones: Visualizes levels as horizontal "boxes" (Zones) rather than simple lines, representing the actual price range where orders are clustered.
Clean Visuals: All data labels are anchored to the right-side margin, keeping the main chart clean and focused on price movement.
Strategic Purpose & Risk Warning
CRITICAL: This indicator is NOT a standalone "Buy/Sell" signal generator.
The primary goal of this tool is to act as a Confluence Factor (Secondary Confirmation) for your trading strategy. To trade successfully with this indicator, you must:
Analyze Price Action: Look for candlestick patterns (like pin bars or engulfing candles) near the highlighted zones.
Follow the Trend: Always align your trades with the overall market structure (Order Flow). A "90% strength" resistance level is more likely to break if the macro trend is strongly bullish.
Use as Confirmation: Use the strength percentage to filter out "weak" levels and focus only on high-probability zones where smart money has previously shown interest.
Trading involves significant risk. Never rely solely on a single indicator for execution.
Overview
The Precision S&R Strength analyzer is a sophisticated technical tool designed to identify and quantify the importance of Support and Resistance levels. Unlike standard pivot-point indicators, this script calculates a dynamic strength percentage for each level based on historical price interaction and accumulated trading volume.
Core Functionality
Smart Level Detection: Automatically identifies key high and low pivot points.
Volume & Touch Analysis: Each level is back-tested against the last 300 candles. The strength percentage (displayed on the right margin) is a weighted calculation of how many times the price reacted to the zone and the volume transacted at those prices.
Supply & Demand Zones: Visualizes levels as horizontal "boxes" (Zones) rather than simple lines, representing the actual price range where orders are clustered.
Clean Visuals: All data labels are anchored to the right-side margin, keeping the main chart clean and focused on price movement.
Strategic Purpose & Risk Warning
CRITICAL: This indicator is NOT a standalone "Buy/Sell" signal generator.
The primary goal of this tool is to act as a Confluence Factor (Secondary Confirmation) for your trading strategy. To trade successfully with this indicator, you must:
Analyze Price Action: Look for candlestick patterns (like pin bars or engulfing candles) near the highlighted zones.
Follow the Trend: Always align your trades with the overall market structure (Order Flow). A "90% strength" resistance level is more likely to break if the macro trend is strongly bullish.
Use as Confirmation: Use the strength percentage to filter out "weak" levels and focus only on high-probability zones where smart money has previously shown interest.
Trading involves significant risk. Never rely solely on a single indicator for execution.
Mã nguồn mở
Theo đúng tinh thần TradingView, tác giả của tập lệnh này đã công bố nó dưới dạng mã nguồn mở, để các nhà giao dịch có thể xem xét và xác minh chức năng. Chúc mừng tác giả! Mặc dù bạn có thể sử dụng miễn phí, hãy nhớ rằng việc công bố lại mã phải tuân theo Nội quy.

Thông báo miễn trừ trách nhiệm
Thông tin và các ấn phẩm này không nhằm mục đích, và không cấu thành, lời khuyên hoặc khuyến nghị về tài chính, đầu tư, giao dịch hay các loại khác do TradingView cung cấp hoặc xác nhận. Đọc thêm tại Điều khoản Sử dụng.
Mã nguồn mở
Theo đúng tinh thần TradingView, tác giả của tập lệnh này đã công bố nó dưới dạng mã nguồn mở, để các nhà giao dịch có thể xem xét và xác minh chức năng. Chúc mừng tác giả! Mặc dù bạn có thể sử dụng miễn phí, hãy nhớ rằng việc công bố lại mã phải tuân theo Nội quy.
Thông báo miễn trừ trách nhiệm
Thông tin và các ấn phẩm này không nhằm mục đích, và không cấu thành, lời khuyên hoặc khuyến nghị về tài chính, đầu tư, giao dịch hay các loại khác do TradingView cung cấp hoặc xác nhận. Đọc thêm tại Điều khoản Sử dụng.