Trading-Sparks - Relative Strength Line
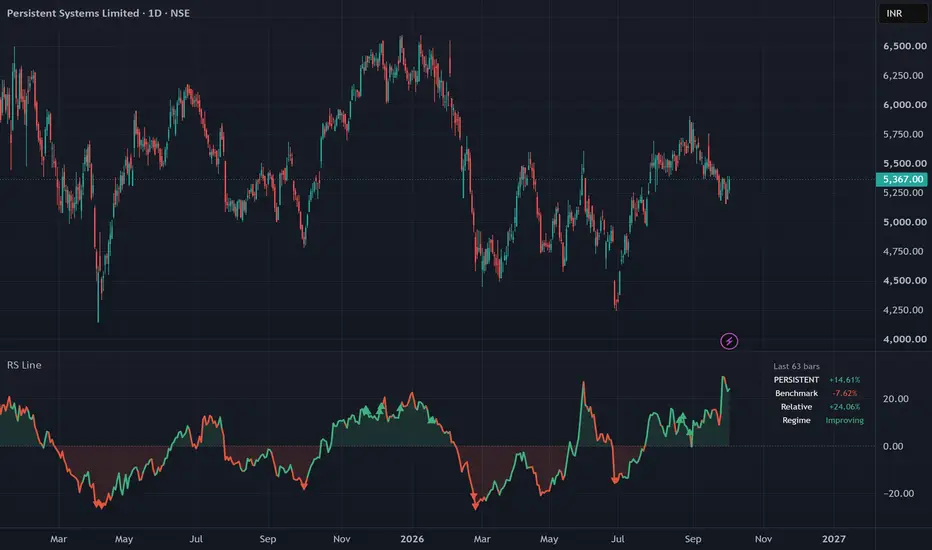
Relative Strength Line shows how the chart symbol has performed against a benchmark over a fixed lookback, colours that line by whether relative strength is improving or weakening, and breaks the result into its two parts so it is clear where the relative number comes from.
What it shows
- A line of relative performance in percent over the lookback. Above zero means the symbol beat the benchmark over that window; below zero means it lagged.
- Colour: green while relative strength is improving, red while it is weakening.
- Triangles where the symbol's relative strength makes a new high or low over a longer window.
- A readout with three numbers for the lookback: the symbol's own % change, the benchmark's % change, and the relative % change.
How it works
The ratio close / benchmark close is computed on the chart's timeframe. Relative performance is the percent change of that ratio over the lookback, which equals (1 + symbol %) / (1 + benchmark %) - 1. The regime colour comes from an EMA of the ratio: improving while the EMA rises, weakening while it falls. New relative highs and lows compare the ratio with its highest and lowest values over the longer window.
Why the decomposition readout
A relative-strength line on its own hides the path. A +8% relative reading can mean the symbol rose 10% while the market rose 2%, or fell 2% while the market fell 9%. Those are very different situations for someone who is long. The readout shows both legs next to the relative figure so the reading cannot be mistaken, which is the reason this script exists alongside simpler ratio plots.
How to use it
- Set the benchmark to what the symbol should be judged against: a sector index for a stock, the broad index for a sector, or a peer.
- Adjust the lookback to your holding period (63 bars is about a quarter on a daily chart).
- Shorter regime smoothing reacts sooner but flips more often.
- Alerts are available for regime changes and for new relative highs and lows.
Limitations
- One symbol against one benchmark; it does not rank or compare many symbols.
- Relative strength describes what has already happened. It is not a forecast and not a trade signal.
- The benchmark is requested on the chart's own timeframe with no lookahead, so it does not repaint historical bars; the current bar updates until it closes.
What it shows
- A line of relative performance in percent over the lookback. Above zero means the symbol beat the benchmark over that window; below zero means it lagged.
- Colour: green while relative strength is improving, red while it is weakening.
- Triangles where the symbol's relative strength makes a new high or low over a longer window.
- A readout with three numbers for the lookback: the symbol's own % change, the benchmark's % change, and the relative % change.
How it works
The ratio close / benchmark close is computed on the chart's timeframe. Relative performance is the percent change of that ratio over the lookback, which equals (1 + symbol %) / (1 + benchmark %) - 1. The regime colour comes from an EMA of the ratio: improving while the EMA rises, weakening while it falls. New relative highs and lows compare the ratio with its highest and lowest values over the longer window.
Why the decomposition readout
A relative-strength line on its own hides the path. A +8% relative reading can mean the symbol rose 10% while the market rose 2%, or fell 2% while the market fell 9%. Those are very different situations for someone who is long. The readout shows both legs next to the relative figure so the reading cannot be mistaken, which is the reason this script exists alongside simpler ratio plots.
How to use it
- Set the benchmark to what the symbol should be judged against: a sector index for a stock, the broad index for a sector, or a peer.
- Adjust the lookback to your holding period (63 bars is about a quarter on a daily chart).
- Shorter regime smoothing reacts sooner but flips more often.
- Alerts are available for regime changes and for new relative highs and lows.
Limitations
- One symbol against one benchmark; it does not rank or compare many symbols.
- Relative strength describes what has already happened. It is not a forecast and not a trade signal.
- The benchmark is requested on the chart's own timeframe with no lookahead, so it does not repaint historical bars; the current bar updates until it closes.

Thông báo miễn trừ trách nhiệm
Thông tin và các ấn phẩm này không nhằm mục đích, và không cấu thành, lời khuyên hoặc khuyến nghị về tài chính, đầu tư, giao dịch hay các loại khác do TradingView cung cấp hoặc xác nhận. Đọc thêm tại Điều khoản Sử dụng.
Thông báo miễn trừ trách nhiệm
Thông tin và các ấn phẩm này không nhằm mục đích, và không cấu thành, lời khuyên hoặc khuyến nghị về tài chính, đầu tư, giao dịch hay các loại khác do TradingView cung cấp hoặc xác nhận. Đọc thêm tại Điều khoản Sử dụng.