MSNR Bias HTF
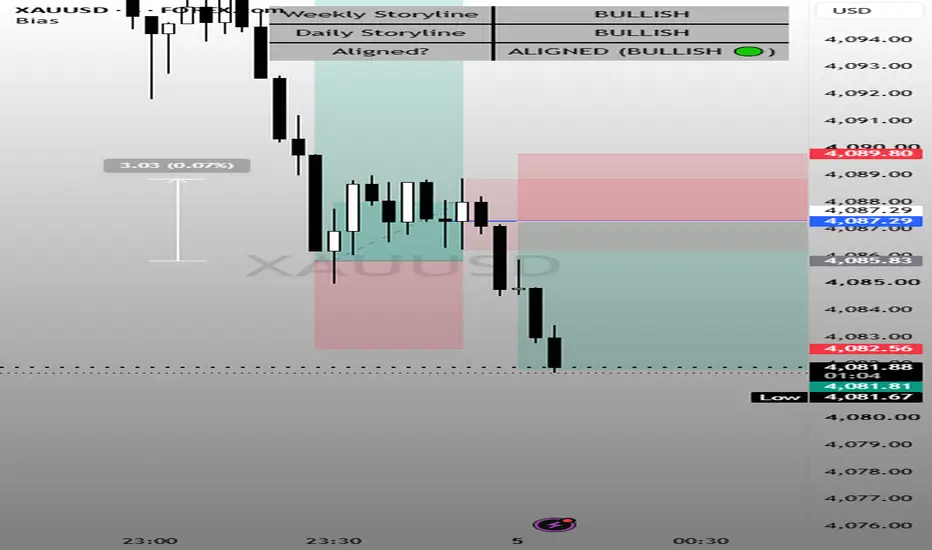
AKFX Storyline Alignment Dashboard (Multi-Timeframe Analysis)
The AKFX Storyline Alignment Dashboard is a multi-timeframe analysis tool designed to help traders quickly determine market bias and alignment across higher and lower timeframes using the concept of Market Storylines.
Instead of trading off single-timeframe signals, this indicator evaluates structural price action on higher timeframes (HTF) and confirms directional continuation via line-chart breakouts on the lower timeframe (LTF).
🟢 How the Storyline Logic Works
A Storyline is defined as the price movement initiated when price interacts with a higher timeframe zone and receives confirmation from the timeframe directly below it.
Weekly Storyline (Macro Bias):
Checks if Current Market Price (CMP) is reacting at a Weekly Support or Resistance zone.
Confirmed when a Daily line-chart breakout occurs (a Daily candle body closes past the local Daily swing high/low).
Daily Storyline (Intermediate Bias):
Checks if CMP is reacting at a Daily Support or Resistance zone.
Confirmed when a 4-Hour (H4) line-chart breakout occurs (an H4 candle body closes past the local H4 swing high/low).
Bias Alignment Status:
ALIGNED (BULLISH 🟢): Both Weekly and Daily storylines are confirmed Bullish. High-probability environment to look for Buy setups.
ALIGNED (BEARISH 🔴): Both Weekly and Daily storylines are confirmed Bearish. High-probability environment to look for Sell setups.
CONFLICTED 🔴: Weekly and Daily storylines point in opposite directions. Exercise caution or wait for alignment.
WAITING FOR SETUP ⚪: One or both storylines are in a neutral/unconfirmed state.
🎨 Key Customization Features
Customizable Dashboard Colors: Configure background fill, text, border, and header colors via the indicator settings.
Default High-Contrast Theme: Pre-styled with a dark gray fill, crisp black text, and a solid black border for maximum readability on any chart background.
Optional Status Highlighting: Includes a toggle (Use Green/Red Status Colors instead of Solid Gray) to instantly highlight alignment with green/red status boxes.
💡 How to Use in Your Trading Strategy
Add the dashboard to your preferred asset (Forex, Crypto, Indices, Stocks).
Check the Bias Alignment Status row:
When ALIGNED: Look for pullback entries at fresh Support/Resistance zones on your execution timeframe (e.g., H1 or 15m) in the direction of the alignment.
When CONFLICTED or WAITING: Sit on your hands or restrict trades to quick scalps, as higher timeframe momentum is divided.
The AKFX Storyline Alignment Dashboard is a multi-timeframe analysis tool designed to help traders quickly determine market bias and alignment across higher and lower timeframes using the concept of Market Storylines.
Instead of trading off single-timeframe signals, this indicator evaluates structural price action on higher timeframes (HTF) and confirms directional continuation via line-chart breakouts on the lower timeframe (LTF).
🟢 How the Storyline Logic Works
A Storyline is defined as the price movement initiated when price interacts with a higher timeframe zone and receives confirmation from the timeframe directly below it.
Weekly Storyline (Macro Bias):
Checks if Current Market Price (CMP) is reacting at a Weekly Support or Resistance zone.
Confirmed when a Daily line-chart breakout occurs (a Daily candle body closes past the local Daily swing high/low).
Daily Storyline (Intermediate Bias):
Checks if CMP is reacting at a Daily Support or Resistance zone.
Confirmed when a 4-Hour (H4) line-chart breakout occurs (an H4 candle body closes past the local H4 swing high/low).
Bias Alignment Status:
ALIGNED (BULLISH 🟢): Both Weekly and Daily storylines are confirmed Bullish. High-probability environment to look for Buy setups.
ALIGNED (BEARISH 🔴): Both Weekly and Daily storylines are confirmed Bearish. High-probability environment to look for Sell setups.
CONFLICTED 🔴: Weekly and Daily storylines point in opposite directions. Exercise caution or wait for alignment.
WAITING FOR SETUP ⚪: One or both storylines are in a neutral/unconfirmed state.
🎨 Key Customization Features
Customizable Dashboard Colors: Configure background fill, text, border, and header colors via the indicator settings.
Default High-Contrast Theme: Pre-styled with a dark gray fill, crisp black text, and a solid black border for maximum readability on any chart background.
Optional Status Highlighting: Includes a toggle (Use Green/Red Status Colors instead of Solid Gray) to instantly highlight alignment with green/red status boxes.
💡 How to Use in Your Trading Strategy
Add the dashboard to your preferred asset (Forex, Crypto, Indices, Stocks).
Check the Bias Alignment Status row:
When ALIGNED: Look for pullback entries at fresh Support/Resistance zones on your execution timeframe (e.g., H1 or 15m) in the direction of the alignment.
When CONFLICTED or WAITING: Sit on your hands or restrict trades to quick scalps, as higher timeframe momentum is divided.

Thông báo miễn trừ trách nhiệm
Thông tin và các ấn phẩm này không nhằm mục đích, và không cấu thành, lời khuyên hoặc khuyến nghị về tài chính, đầu tư, giao dịch hay các loại khác do TradingView cung cấp hoặc xác nhận. Đọc thêm tại Điều khoản Sử dụng.
Thông báo miễn trừ trách nhiệm
Thông tin và các ấn phẩm này không nhằm mục đích, và không cấu thành, lời khuyên hoặc khuyến nghị về tài chính, đầu tư, giao dịch hay các loại khác do TradingView cung cấp hoặc xác nhận. Đọc thêm tại Điều khoản Sử dụng.