EMA 20 Angle Meter
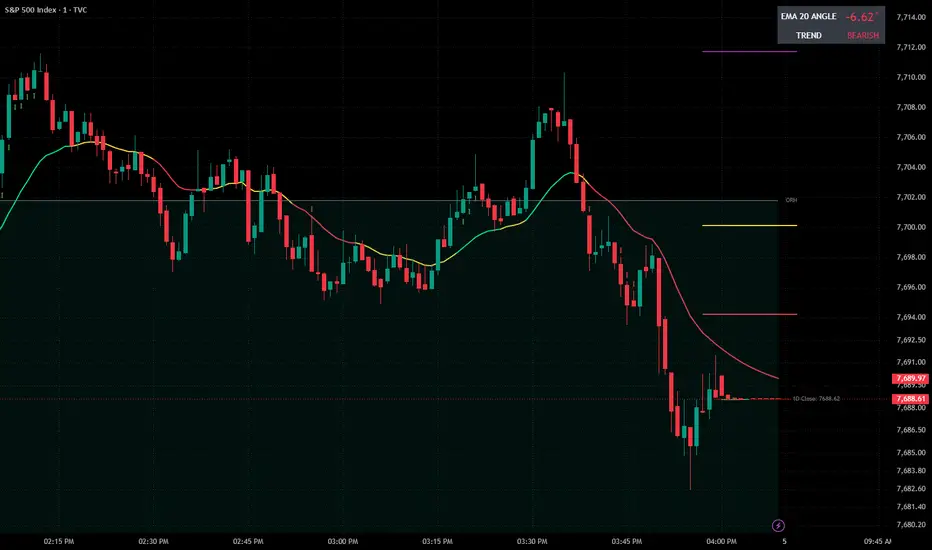
EMA 20 Angle Meter – Measure Trend Strength in Degrees
The EMA 20 Angle Meter is a technical analysis indicator designed to measure the slope and directional strength of the 20-period Exponential Moving Average (EMA).
Instead of simply showing whether the EMA is moving up or down, this indicator calculates its normalized slope and converts it into degrees, providing a numerical representation of trend direction and momentum.
Key Features
Real-Time Angle Measurement: Displays the current EMA 20 slope in degrees.
ATR-Normalized Calculation: Uses Average True Range (ATR) to normalize the EMA slope, reducing sensitivity to price scale and chart zoom.
Dynamic EMA Colors:
Green: Stronger upward slope.
Red: Stronger downward slope.
Yellow: Relatively flat EMA.
Customizable Settings: Adjust EMA length, slope lookback period, ATR length, and flat-angle threshold.
On-Chart Dashboard: Displays the current angle and trend condition directly on your chart.
How to Interpret the Indicator
The angle reading helps traders evaluate the direction and steepness of the EMA:
Positive degrees indicate an upward-sloping EMA.
Negative degrees indicate a downward-sloping EMA.
Readings near zero indicate a relatively flat EMA.
Increasing positive readings indicate a steepening upward slope.
Increasing negative magnitude indicates a steepening downward slope.
Suggested Settings
For traders using the 1-minute ES, MES, and S&P 500 charts:
EMA Length: 20
Slope Lookback: 5 bars
ATR Length: 14
Flat Threshold: 5 degrees
All settings can be customized for different markets and timeframes.
Trading Applications
The EMA 20 Angle Meter can help traders:
Identify trending versus sideways market conditions.
Evaluate trend strength.
Monitor changes in momentum.
Identify when an established trend begins to flatten.
Complement price action, moving average, and breakout strategies.
Important Note
The displayed angle represents a mathematically normalized EMA slope, not the literal visual angle of the EMA line on the chart. Values are dependent on the selected lookback period and ATR normalization.
This indicator is intended as a technical analysis tool and should not be used as a standalone buy or sell signal.
Disclaimer: This indicator is for educational and informational purposes only. It does not constitute financial advice or a recommendation to buy or sell any financial instrument.
The EMA 20 Angle Meter is a technical analysis indicator designed to measure the slope and directional strength of the 20-period Exponential Moving Average (EMA).
Instead of simply showing whether the EMA is moving up or down, this indicator calculates its normalized slope and converts it into degrees, providing a numerical representation of trend direction and momentum.
Key Features
Real-Time Angle Measurement: Displays the current EMA 20 slope in degrees.
ATR-Normalized Calculation: Uses Average True Range (ATR) to normalize the EMA slope, reducing sensitivity to price scale and chart zoom.
Dynamic EMA Colors:
Green: Stronger upward slope.
Red: Stronger downward slope.
Yellow: Relatively flat EMA.
Customizable Settings: Adjust EMA length, slope lookback period, ATR length, and flat-angle threshold.
On-Chart Dashboard: Displays the current angle and trend condition directly on your chart.
How to Interpret the Indicator
The angle reading helps traders evaluate the direction and steepness of the EMA:
Positive degrees indicate an upward-sloping EMA.
Negative degrees indicate a downward-sloping EMA.
Readings near zero indicate a relatively flat EMA.
Increasing positive readings indicate a steepening upward slope.
Increasing negative magnitude indicates a steepening downward slope.
Suggested Settings
For traders using the 1-minute ES, MES, and S&P 500 charts:
EMA Length: 20
Slope Lookback: 5 bars
ATR Length: 14
Flat Threshold: 5 degrees
All settings can be customized for different markets and timeframes.
Trading Applications
The EMA 20 Angle Meter can help traders:
Identify trending versus sideways market conditions.
Evaluate trend strength.
Monitor changes in momentum.
Identify when an established trend begins to flatten.
Complement price action, moving average, and breakout strategies.
Important Note
The displayed angle represents a mathematically normalized EMA slope, not the literal visual angle of the EMA line on the chart. Values are dependent on the selected lookback period and ATR normalization.
This indicator is intended as a technical analysis tool and should not be used as a standalone buy or sell signal.
Disclaimer: This indicator is for educational and informational purposes only. It does not constitute financial advice or a recommendation to buy or sell any financial instrument.

Thông báo miễn trừ trách nhiệm
Thông tin và các ấn phẩm này không nhằm mục đích, và không cấu thành, lời khuyên hoặc khuyến nghị về tài chính, đầu tư, giao dịch hay các loại khác do TradingView cung cấp hoặc xác nhận. Đọc thêm tại Điều khoản Sử dụng.
Thông báo miễn trừ trách nhiệm
Thông tin và các ấn phẩm này không nhằm mục đích, và không cấu thành, lời khuyên hoặc khuyến nghị về tài chính, đầu tư, giao dịch hay các loại khác do TradingView cung cấp hoặc xác nhận. Đọc thêm tại Điều khoản Sử dụng.