Cập nhật
Volume Flow Indicator (Classic)
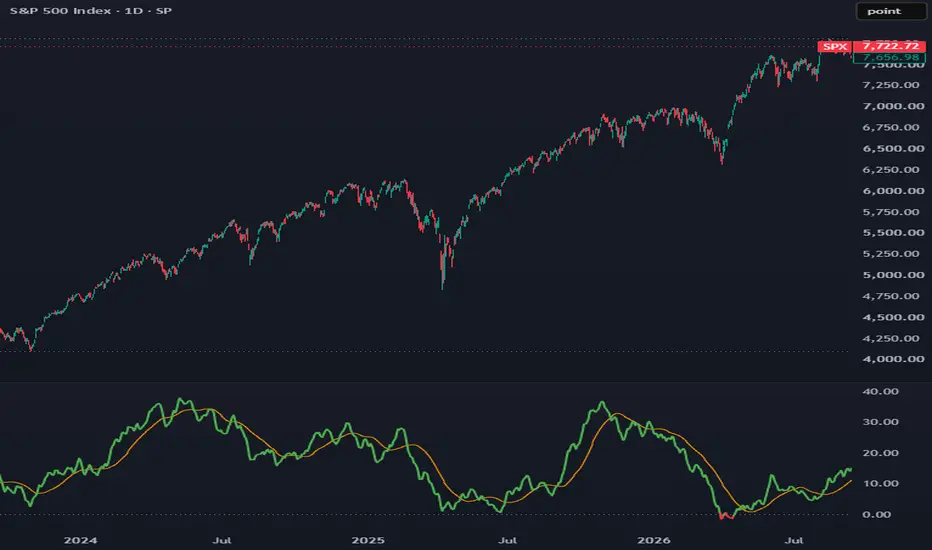
█ OVERVIEW
Volume Flow Indicator (Classic) plots Markos Katsanos's Volume Flow Indicator (VFI) in a separate pane, using the calculation and default settings from the author's published reference code. The thesis is that volume traded on price changes larger than a volatility threshold, summed over a fixed window and scaled by average volume, measures accumulation and distribution with less noise than On Balance Volume.
This version differs from LazyBear's public VFI script in its default smoothing and its signal line, so the two scripts do not produce matching values at default settings. The differences are listed under WHAT MAKES IT ORIGINAL.
█ HISTORY / BACKGROUND
Markos Katsanos introduced VFI in the June 2004 issue of Technical Analysis of Stocks & Commodities. The method is published and not proprietary. This script implements it without changing the calculation.
Katsanos started from On Balance Volume (OBV) and changed it in four ways:
• The reading has an absolute meaning. VFI is positive when net volume flow is upward and negative when it is downward, while the level of OBV depends on the first bar of data loaded.
• Price direction comes from the typical price, the average of high, low and close, rather than from the close.
• A volatility threshold excludes price changes too small to matter, and a cap limits the weight of any single volume spike.
• Volume is summed over a rolling window of 130 bars, about six months of daily data, rather than over the full chart history.
OBV assigns a bar's full volume to the direction of the close-to-close change regardless of its size. A one-tick move counts as much as a breakout, and one abnormal session shifts the series for the rest of the chart. VFI keeps the premise that volume on rising prices reflects demand and volume on falling prices reflects supply, and removes the two sources of noise described above: insignificant price changes and outlier volume. Dividing by average volume expresses the output in bars of average volume, which makes readings comparable across symbols with different trading volume.
█ HOW IT WORKS
The script computes the following on every bar.
1. Typical price, TP, is (high + low + close) / 3.
2. The log return of TP from the previous bar is computed, and its population standard deviation is taken over the last 30 bars. The 30-bar window is fixed in the code.
3. The cutoff converts that volatility into a price distance. Cutoff = coefficient × standard deviation × close.
4. Average volume is the simple moving average of volume over the VFI period, read from the previous bar so that the current bar's volume is excluded.
5. The volume cap is average volume × max volume cutoff. Each bar's volume is limited to the cap.
6. Money flow is TP minus the previous bar's TP. When money flow is above the cutoff, the bar contributes its capped volume as a positive value. When money flow is below the negative cutoff, the bar contributes its capped volume as a negative value. Otherwise the bar contributes zero.
7. Raw VFI is the sum of these signed volumes over the VFI period, divided by average volume. A raw VFI of 10 means net upward flow equal to ten bars of average volume.
8. VFI is an EMA of raw VFI over the EMA smoothing length.
9. The signal line is an SMA of VFI over the signal SMA length.
█ HOW TO USE
The author's interpretation is that VFI above zero marks a bullish volume trend and VFI below zero a bearish one, with the zero-line cross as the trigger. He identifies divergence between price and VFI as the strongest signal, for example price making a higher high while VFI makes a lower high. The script does not detect divergences or crossovers. They are read from the chart.
Visual elements:
• VFI line, width 2. Green when VFI is zero or above, red when VFI is below zero.
• Signal line, orange. This is the SMA of VFI, which the author plots as a slower reference for the direction of the volume trend.
• Zero line, gray and dotted.
The script creates no labels, markers, fills or alert conditions.
The recommended timeframe is daily. The code contains no timeframe logic and runs on any resolution, but its defaults assume daily bars. 130 bars is about six months of trading days, the window the author specified, and the 30-bar volatility window is about six weeks. On weekly charts, a VFI period near 26 covers the same six months. On intraday charts the same bar counts cover hours or days, and the simple average of volume does not adjust for the time-of-day pattern in intraday volume, so the volume cap and the normalization behave differently than on daily data.
█ SETTINGS
• VFI period sets the window for the signed-volume sum and for the average volume used to cap and normalize it. Default 130, minimum 2.
• Price cutoff coefficient scales the volatility threshold. Higher values exclude more small price changes from the flow. A value of 0 counts every nonzero change in typical price. Default 0.2.
• Max volume cutoff sets the volume cap as a multiple of average volume. Default 2.5, minimum 1.
• EMA smoothing sets the EMA length applied to raw VFI. A value of 1 plots raw VFI. Default 3.
• Signal SMA length sets the length of the signal line's simple average. Default 30.
The 30-bar volatility window is not an input.
█ WHAT MAKES IT ORIGINAL
VFI is Katsanos's method, and this script does not alter its calculation. This publication provides an implementation that matches the author's reference defaults, written in Pine v6, with its differences from the existing public version stated here. LazyBear's Volume Flow Indicator script uses the same core calculation and the same default period, price cutoff coefficient, max volume cutoff and 30-bar volatility window. It differs in these respects:
• Smoothing. LazyBear's script plots raw VFI by default, and its smoothing option applies a 3-bar SMA. This script always applies an EMA with a default length of 3, as the author's code does. At default settings the two scripts produce different VFI values.
• Signal line. LazyBear's script uses a 5-bar EMA of VFI. This script uses a 30-bar SMA, the author's default. A 5-bar EMA tracks VFI closely, while a 30-bar SMA lags it by about 15 bars, so crossovers of VFI and its signal line occur on different bars and at different frequencies in the two scripts.
• Histogram. LazyBear's script includes an optional histogram of VFI minus its signal line. This script has none.
• Line color. This script colors VFI by sign. LazyBear's VFI line is a single color.
• Language version. LazyBear's script uses Pine v1 syntax. This script is written in Pine v6.
• Volume check. This script stops with a runtime error when the symbol reports no volume, rather than rendering an empty pane.
█ NOTES / LIMITATIONS
• History. VFI first plots after about 260 bars at default settings, roughly twice the VFI period. Average volume needs one full period of history, and the signed-volume sum needs a second. The signal line starts 29 bars after VFI. Symbols with less history show a partial line or an empty pane. A longer VFI period raises this requirement.
• Volume. The script requires volume data. If no bar on the chart reports volume, the script stops with a runtime error. Many index, economic and currency symbols report none. Where a symbol's volume is a tick count or the volume of a single venue, VFI measures that series rather than total traded volume.
• Timeframe. The defaults assume daily bars, as described under HOW TO USE.
• Realtime updates. The script makes no higher-timeframe requests and uses no lookahead or plot offsets, so values on closed bars do not change. On the open bar, VFI and the signal line update with each price and volume change until the bar closes.
Volume Flow Indicator (Classic) plots Markos Katsanos's Volume Flow Indicator (VFI) in a separate pane, using the calculation and default settings from the author's published reference code. The thesis is that volume traded on price changes larger than a volatility threshold, summed over a fixed window and scaled by average volume, measures accumulation and distribution with less noise than On Balance Volume.
This version differs from LazyBear's public VFI script in its default smoothing and its signal line, so the two scripts do not produce matching values at default settings. The differences are listed under WHAT MAKES IT ORIGINAL.
█ HISTORY / BACKGROUND
Markos Katsanos introduced VFI in the June 2004 issue of Technical Analysis of Stocks & Commodities. The method is published and not proprietary. This script implements it without changing the calculation.
Katsanos started from On Balance Volume (OBV) and changed it in four ways:
• The reading has an absolute meaning. VFI is positive when net volume flow is upward and negative when it is downward, while the level of OBV depends on the first bar of data loaded.
• Price direction comes from the typical price, the average of high, low and close, rather than from the close.
• A volatility threshold excludes price changes too small to matter, and a cap limits the weight of any single volume spike.
• Volume is summed over a rolling window of 130 bars, about six months of daily data, rather than over the full chart history.
OBV assigns a bar's full volume to the direction of the close-to-close change regardless of its size. A one-tick move counts as much as a breakout, and one abnormal session shifts the series for the rest of the chart. VFI keeps the premise that volume on rising prices reflects demand and volume on falling prices reflects supply, and removes the two sources of noise described above: insignificant price changes and outlier volume. Dividing by average volume expresses the output in bars of average volume, which makes readings comparable across symbols with different trading volume.
█ HOW IT WORKS
The script computes the following on every bar.
1. Typical price, TP, is (high + low + close) / 3.
2. The log return of TP from the previous bar is computed, and its population standard deviation is taken over the last 30 bars. The 30-bar window is fixed in the code.
3. The cutoff converts that volatility into a price distance. Cutoff = coefficient × standard deviation × close.
4. Average volume is the simple moving average of volume over the VFI period, read from the previous bar so that the current bar's volume is excluded.
5. The volume cap is average volume × max volume cutoff. Each bar's volume is limited to the cap.
6. Money flow is TP minus the previous bar's TP. When money flow is above the cutoff, the bar contributes its capped volume as a positive value. When money flow is below the negative cutoff, the bar contributes its capped volume as a negative value. Otherwise the bar contributes zero.
7. Raw VFI is the sum of these signed volumes over the VFI period, divided by average volume. A raw VFI of 10 means net upward flow equal to ten bars of average volume.
8. VFI is an EMA of raw VFI over the EMA smoothing length.
9. The signal line is an SMA of VFI over the signal SMA length.
█ HOW TO USE
The author's interpretation is that VFI above zero marks a bullish volume trend and VFI below zero a bearish one, with the zero-line cross as the trigger. He identifies divergence between price and VFI as the strongest signal, for example price making a higher high while VFI makes a lower high. The script does not detect divergences or crossovers. They are read from the chart.
Visual elements:
• VFI line, width 2. Green when VFI is zero or above, red when VFI is below zero.
• Signal line, orange. This is the SMA of VFI, which the author plots as a slower reference for the direction of the volume trend.
• Zero line, gray and dotted.
The script creates no labels, markers, fills or alert conditions.
The recommended timeframe is daily. The code contains no timeframe logic and runs on any resolution, but its defaults assume daily bars. 130 bars is about six months of trading days, the window the author specified, and the 30-bar volatility window is about six weeks. On weekly charts, a VFI period near 26 covers the same six months. On intraday charts the same bar counts cover hours or days, and the simple average of volume does not adjust for the time-of-day pattern in intraday volume, so the volume cap and the normalization behave differently than on daily data.
█ SETTINGS
• VFI period sets the window for the signed-volume sum and for the average volume used to cap and normalize it. Default 130, minimum 2.
• Price cutoff coefficient scales the volatility threshold. Higher values exclude more small price changes from the flow. A value of 0 counts every nonzero change in typical price. Default 0.2.
• Max volume cutoff sets the volume cap as a multiple of average volume. Default 2.5, minimum 1.
• EMA smoothing sets the EMA length applied to raw VFI. A value of 1 plots raw VFI. Default 3.
• Signal SMA length sets the length of the signal line's simple average. Default 30.
The 30-bar volatility window is not an input.
█ WHAT MAKES IT ORIGINAL
VFI is Katsanos's method, and this script does not alter its calculation. This publication provides an implementation that matches the author's reference defaults, written in Pine v6, with its differences from the existing public version stated here. LazyBear's Volume Flow Indicator script uses the same core calculation and the same default period, price cutoff coefficient, max volume cutoff and 30-bar volatility window. It differs in these respects:
• Smoothing. LazyBear's script plots raw VFI by default, and its smoothing option applies a 3-bar SMA. This script always applies an EMA with a default length of 3, as the author's code does. At default settings the two scripts produce different VFI values.
• Signal line. LazyBear's script uses a 5-bar EMA of VFI. This script uses a 30-bar SMA, the author's default. A 5-bar EMA tracks VFI closely, while a 30-bar SMA lags it by about 15 bars, so crossovers of VFI and its signal line occur on different bars and at different frequencies in the two scripts.
• Histogram. LazyBear's script includes an optional histogram of VFI minus its signal line. This script has none.
• Line color. This script colors VFI by sign. LazyBear's VFI line is a single color.
• Language version. LazyBear's script uses Pine v1 syntax. This script is written in Pine v6.
• Volume check. This script stops with a runtime error when the symbol reports no volume, rather than rendering an empty pane.
█ NOTES / LIMITATIONS
• History. VFI first plots after about 260 bars at default settings, roughly twice the VFI period. Average volume needs one full period of history, and the signed-volume sum needs a second. The signal line starts 29 bars after VFI. Symbols with less history show a partial line or an empty pane. A longer VFI period raises this requirement.
• Volume. The script requires volume data. If no bar on the chart reports volume, the script stops with a runtime error. Many index, economic and currency symbols report none. Where a symbol's volume is a tick count or the volume of a single venue, VFI measures that series rather than total traded volume.
• Timeframe. The defaults assume daily bars, as described under HOW TO USE.
• Realtime updates. The script makes no higher-timeframe requests and uses no lookahead or plot offsets, so values on closed bars do not change. On the open bar, VFI and the signal line update with each price and volume change until the bar closes.
Phát hành các Ghi chú
Added a Method input with three volume flow calculations by Markos Katsanos. VFI remains the default.VFI (Technical Analysis of Stocks & Commodities, June 2004): calculation and defaults are unchanged. 130-bar period, 3-bar EMA smoothing, 30-bar SMA signal line.
FVE, Finite Volume Elements (April and September 2003): a Cutoff input selects the September 2003 volatility cutoff, which is the default, or the April 2003 fixed cutoff of 0.3% of close. 22-bar period, 40-bar EMA signal line.
VPN, Volume Positive Negative (April 2021): a bar's volume counts when its typical price moves more than 0.1 ATR from the prior bar. 30-bar period, 3-bar EMA smoothing, 30-bar SMA signal line, and a critical level line at 10.
Each method has its own input group, and the groups for methods not selected are greyed out. The three methods use different scales, so readings are not comparable across methods.
Each method now plots only after every bar in its window has a defined cutoff and volume average, so no plotted value is computed from a partial window. VFI values after this warm-up period are unchanged.
The status line now shows only the selected method.

Thông báo miễn trừ trách nhiệm
Thông tin và các ấn phẩm này không nhằm mục đích, và không cấu thành, lời khuyên hoặc khuyến nghị về tài chính, đầu tư, giao dịch hay các loại khác do TradingView cung cấp hoặc xác nhận. Đọc thêm tại Điều khoản Sử dụng.
Thông báo miễn trừ trách nhiệm
Thông tin và các ấn phẩm này không nhằm mục đích, và không cấu thành, lời khuyên hoặc khuyến nghị về tài chính, đầu tư, giao dịch hay các loại khác do TradingView cung cấp hoặc xác nhận. Đọc thêm tại Điều khoản Sử dụng.