OPEN-SOURCE SCRIPT
20/200 Simple Moving Average
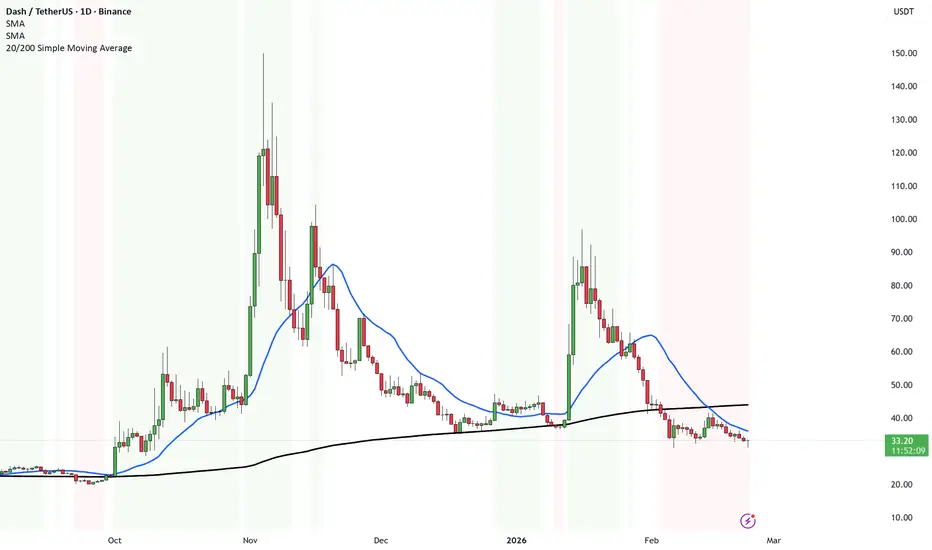
This indicator shows you the big trend vs the medium trend — and colors the chart so you don’t have to think too much.
Here’s what it does in simple terms:
What are the two lines?
20 SMA = the average price of the last 20 candles → short/medium-term direction.
200 SMA = the average price of the last 200 candles → long-term trend.
Think of it like:
20 = recent behavior.
200 = overall direction.
What the Background Colors Mean
🟢 Green Background
Price is ABOVE both the 20 and the 200.
That means:
Short-term trend is strong.
Long-term trend is bullish.
Market structure is healthy.
This is bullish territory.
🔴 Red Background
Price is BELOW both the 20 and the 200.
That means:
Short-term trend is weak.
Long-term trend is bearish.
Sellers are in control.
This is bearish territory.
⚪ White / No Color
Price is stuck between the two averages.
That means:
No clear trend.
Market is deciding.
Higher chance of chop.
Buy & Sell Signals (Crossovers)
Buy Territory:
When the 20 crosses ABOVE the 200 and price is already above the 200.
That’s momentum shifting bullish inside a confirmed trend.
Sell Territory:
When the 20 crosses BELOW the 200 and price is already below the 200.
That’s momentum turning bearish in a downtrend.
In very simple words:
Green = strong uptrend.
Red = strong downtrend.
White = messy middle.
Here’s what it does in simple terms:
What are the two lines?
20 SMA = the average price of the last 20 candles → short/medium-term direction.
200 SMA = the average price of the last 200 candles → long-term trend.
Think of it like:
20 = recent behavior.
200 = overall direction.
What the Background Colors Mean
🟢 Green Background
Price is ABOVE both the 20 and the 200.
That means:
Short-term trend is strong.
Long-term trend is bullish.
Market structure is healthy.
This is bullish territory.
🔴 Red Background
Price is BELOW both the 20 and the 200.
That means:
Short-term trend is weak.
Long-term trend is bearish.
Sellers are in control.
This is bearish territory.
⚪ White / No Color
Price is stuck between the two averages.
That means:
No clear trend.
Market is deciding.
Higher chance of chop.
Buy & Sell Signals (Crossovers)
Buy Territory:
When the 20 crosses ABOVE the 200 and price is already above the 200.
That’s momentum shifting bullish inside a confirmed trend.
Sell Territory:
When the 20 crosses BELOW the 200 and price is already below the 200.
That’s momentum turning bearish in a downtrend.
In very simple words:
Green = strong uptrend.
Red = strong downtrend.
White = messy middle.
Mã nguồn mở
Theo đúng tinh thần TradingView, tác giả của tập lệnh này đã công bố nó dưới dạng mã nguồn mở, để các nhà giao dịch có thể xem xét và xác minh chức năng. Chúc mừng tác giả! Mặc dù bạn có thể sử dụng miễn phí, hãy nhớ rằng việc công bố lại mã phải tuân theo Nội quy.

🌐NEW Website 2025:
mati-trader.lovable.app/
✅ Facebook:
facebook.com/groups/matitrader
𝕏 (Formerly Twitter):
twitter.com/timonr
Trade Well,
Timon Rossolimos
Founder, MATI Trader
(Pro trader since 2003)
mati-trader.lovable.app/
✅ Facebook:
facebook.com/groups/matitrader
𝕏 (Formerly Twitter):
twitter.com/timonr
Trade Well,
Timon Rossolimos
Founder, MATI Trader
(Pro trader since 2003)
Thông báo miễn trừ trách nhiệm
Thông tin và các ấn phẩm này không nhằm mục đích, và không cấu thành, lời khuyên hoặc khuyến nghị về tài chính, đầu tư, giao dịch hay các loại khác do TradingView cung cấp hoặc xác nhận. Đọc thêm tại Điều khoản Sử dụng.
Mã nguồn mở
Theo đúng tinh thần TradingView, tác giả của tập lệnh này đã công bố nó dưới dạng mã nguồn mở, để các nhà giao dịch có thể xem xét và xác minh chức năng. Chúc mừng tác giả! Mặc dù bạn có thể sử dụng miễn phí, hãy nhớ rằng việc công bố lại mã phải tuân theo Nội quy.
🌐NEW Website 2025:
mati-trader.lovable.app/
✅ Facebook:
facebook.com/groups/matitrader
𝕏 (Formerly Twitter):
twitter.com/timonr
Trade Well,
Timon Rossolimos
Founder, MATI Trader
(Pro trader since 2003)
mati-trader.lovable.app/
✅ Facebook:
facebook.com/groups/matitrader
𝕏 (Formerly Twitter):
twitter.com/timonr
Trade Well,
Timon Rossolimos
Founder, MATI Trader
(Pro trader since 2003)
Thông báo miễn trừ trách nhiệm
Thông tin và các ấn phẩm này không nhằm mục đích, và không cấu thành, lời khuyên hoặc khuyến nghị về tài chính, đầu tư, giao dịch hay các loại khác do TradingView cung cấp hoặc xác nhận. Đọc thêm tại Điều khoản Sử dụng.