OPEN-SOURCE SCRIPT
Cập nhật Trend Architect [Signals and Overlays]
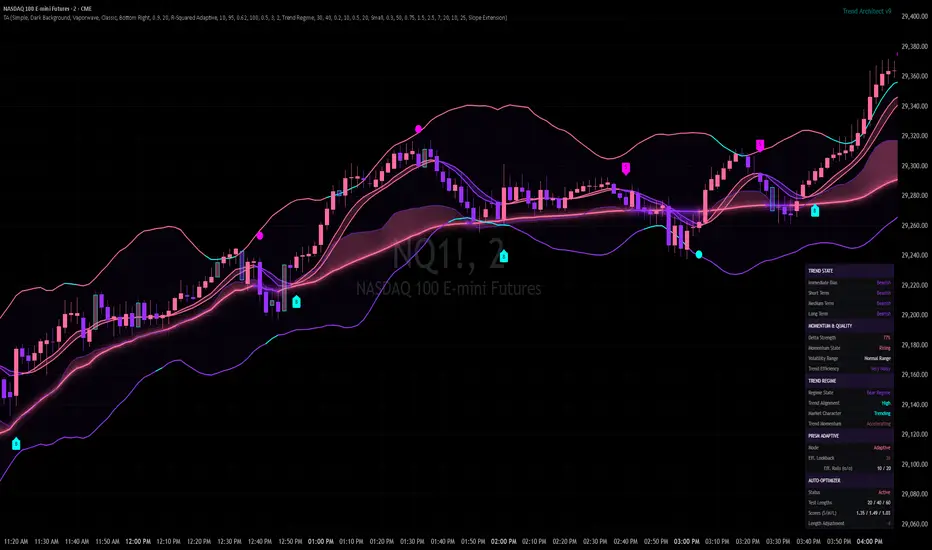
TREND ARCHITECT v9
Trend Architect is a multi-layer overlay and signals indicator built for active traders — scalpers, day traders, and prop traders working on fast timeframes like the 1-minute and 2-minute charts on instruments like MGC, MNQ, or currency pairs. It combines trend identification, volatility bands, momentum filtering, and a signal engine into a single, cohesive all-in-one tool.
The design goal is straightforward: give you a clear read on trend direction and market structure at a glance, and surface buy and sell signals only when multiple independent filters agree.
Everything is controlled through a Simple / Advanced mode selector. Simple mode gives you clean on/off toggles and runs on carefully tuned defaults. Advanced mode opens every parameter for fine-tuning. Most traders will get full value from Simple mode.
━━━ THEMES & CUSTOMIZATION ━━━
Trend Architect comes with 32 color themes — 16 for dark chart backgrounds, 16 for light. Every visual element updates together: the cloud, channel bands, candle colors, signal labels, and the info panel.

━━━ THE FIVE TOOLS ━━━
── Trend Cloud ──

The Trend Cloud is the backbone of the indicator. The base line represents the primary core trend at the longest scale. The shaded fill above it reflects trend spread and strength — a wider, more opaque fill means stronger agreement across timeframes.
The base line glows in your bullish or bearish theme color depending on slope direction. At a glance: if the cloud is wide and the base is rising, the market is trending. If base is narrowing, trend is weakening and if the base is flat markets are ranging.
── Super Channel ──

The Super Channel draws dynamic upper and lower volatility bands around price. It blends three volatility measures — a Keltner Channel, Bollinger Bands, and an internal consensus oscillator — to produce bands that adapt to both volatility and momentum conditions.
When the consensus oscillator reaches overbought or oversold levels, the relevant band highlights in your theme's accent color. This is a useful heads-up that price is extended and conditions may be ripe for a reversal or pause.
── Moving Average Ribbon ──

Two smooth moving average lines with a colored fill between them. When the fast line is above the slow line, the fill is bullish. When reversed, bearish. It's a short-term momentum read. Many use the crossover as signal confirmation.
── Custom Candles ──
Trend Architect draws its own candles, replacing the chart's native candlesticks. The default type is R-Squared Adaptive Linear Regression: during trending conditions, candles blend toward a linear regression; during choppy conditions, they stay close to real price. The result is a smoother visual without the price displacement of standard Heikin Ashi.
Four other candle types are available: Regular Candlesticks, Custom Heikin Ashi, Custom LinReg Heikin Ashi, and Standard LinReg Candles.
When buying or selling pressure is unusually one-sided — measured by volume delta — the candle body dims and the border highlights in your theme's accent color. This is the Delta Border Highlight: a quick flag that a bar had real conviction behind it.
── PRISM Signals ──

PRISM is the signal engine. It continuously analyzes price structure and momentum, and provides a B (buy) or S (sell) label when a directional shift is detected and several independent filters agree that conditions are good enough to act on.
Every raw signal candidate passes through four filters before a label appears:
── Boundary Forecast ──
The Boundary Forecast projects the Trend Cloud and Super Channel bands a few bars into the future. Two modes are available: Regression fits a curve to recent band movement and can show potential turns ahead; Slope Extension simply continues the current direction in a straight line.
The lines fade the further out they go to reflect decreasing confidence. Useful for anticipating where the next structural level is likely to be, not for precise entries.
━━━ AUTO-OPTIMIZER ━━━
The Auto-Optimizer runs three parallel versions of the PRISM signal engine at different lookback lengths (short, mid, long — spaced by a configurable percentage around the base length). Each version tracks its own signal history and scores every signal based on how far price moved favorably within a set number of bars, in ATR tiers.
The optimizer continuously weights the three lengths by recent performance and blends them into a single effective lookback that is applied to the main signal engine.
━━━ INFO PANEL ━━━
The info panel is a live dashboard showing current conditions across four sections: Trend State, Momentum & Quality, Trend Regime, and PRISM Signals / Auto-Optimizer.
Position it anywhere on the chart using the Info Panel Location dropdown.
TREND ARCHITECT — QUICK START GUIDE
━━━ ADDING THE INDICATOR ━━━
━━━ HIDE YOUR DEFAULT CANDLES ━━━
Trend Architect draws its own custom candles, so you'll want to hide the chart's native candlesticks to avoid visual clutter.
On the chart:
Your chart background will now be clean and the indicator's candles will be the only ones visible.
━━━ SETTINGS MODE: SIMPLE vs. ADVANCED ━━━
The very first setting at the top of the indicator controls are unlocked.
You can switch between modes at any time without losing your settings.
━━━ CHOOSING A THEME ━━━
Under Visual Components in the settings panel:
━━━ INFO PANEL ━━━
Toggle Enable Info Panel in Visual Components to show a live dashboard with:
You can reposition it via the Info Panel Location dropdown.
━━━ TIPS FOR GETTING STARTED ━━━
Trend Architect is a multi-layer overlay and signals indicator built for active traders — scalpers, day traders, and prop traders working on fast timeframes like the 1-minute and 2-minute charts on instruments like MGC, MNQ, or currency pairs. It combines trend identification, volatility bands, momentum filtering, and a signal engine into a single, cohesive all-in-one tool.
The design goal is straightforward: give you a clear read on trend direction and market structure at a glance, and surface buy and sell signals only when multiple independent filters agree.
Everything is controlled through a Simple / Advanced mode selector. Simple mode gives you clean on/off toggles and runs on carefully tuned defaults. Advanced mode opens every parameter for fine-tuning. Most traders will get full value from Simple mode.
━━━ THEMES & CUSTOMIZATION ━━━
Trend Architect comes with 32 color themes — 16 for dark chart backgrounds, 16 for light. Every visual element updates together: the cloud, channel bands, candle colors, signal labels, and the info panel.
━━━ THE FIVE TOOLS ━━━
── Trend Cloud ──
The Trend Cloud is the backbone of the indicator. The base line represents the primary core trend at the longest scale. The shaded fill above it reflects trend spread and strength — a wider, more opaque fill means stronger agreement across timeframes.
The base line glows in your bullish or bearish theme color depending on slope direction. At a glance: if the cloud is wide and the base is rising, the market is trending. If base is narrowing, trend is weakening and if the base is flat markets are ranging.
── Super Channel ──
The Super Channel draws dynamic upper and lower volatility bands around price. It blends three volatility measures — a Keltner Channel, Bollinger Bands, and an internal consensus oscillator — to produce bands that adapt to both volatility and momentum conditions.
When the consensus oscillator reaches overbought or oversold levels, the relevant band highlights in your theme's accent color. This is a useful heads-up that price is extended and conditions may be ripe for a reversal or pause.
── Moving Average Ribbon ──
Two smooth moving average lines with a colored fill between them. When the fast line is above the slow line, the fill is bullish. When reversed, bearish. It's a short-term momentum read. Many use the crossover as signal confirmation.
── Custom Candles ──
Trend Architect draws its own candles, replacing the chart's native candlesticks. The default type is R-Squared Adaptive Linear Regression: during trending conditions, candles blend toward a linear regression; during choppy conditions, they stay close to real price. The result is a smoother visual without the price displacement of standard Heikin Ashi.
Four other candle types are available: Regular Candlesticks, Custom Heikin Ashi, Custom LinReg Heikin Ashi, and Standard LinReg Candles.
When buying or selling pressure is unusually one-sided — measured by volume delta — the candle body dims and the border highlights in your theme's accent color. This is the Delta Border Highlight: a quick flag that a bar had real conviction behind it.
── PRISM Signals ──
PRISM is the signal engine. It continuously analyzes price structure and momentum, and provides a B (buy) or S (sell) label when a directional shift is detected and several independent filters agree that conditions are good enough to act on.
Every raw signal candidate passes through four filters before a label appears:
- Structure Lock — If short-term momentum is pushing against the signal direction at the moment it triggers, the signal is held to get confirmation. If confirmation doesn't come, the signal is cancelled. This reduces entries during choppy reversals where the signal fires a little early.
- Bar Quality — The signal waits for a candle that closed convincingly in the signal direction. An indecisive bar — small body, lots of wick — causes the signal to hold for a cleaner close. If a clean bar doesn't appear in time, the signal is fully cancelled.
- Quality Gate — When market conditions are weak — low directional efficiency, flat momentum — the signal is downgraded to a small dot rather than a full B/S label. A dot means the setup was detected but conditions aren't ideal. Dots can still upgrade to full signals if other strong conditions are met simultaneously.
- Trend Regime Gate — When the market is clearly trending in one direction, signals triggered against that trend are suppressed and downgraded to dots rather than dropped entirely. A bull regime suppresses counter-trend sells; a bear regime suppresses counter-trend buys. The current regime state is always visible in the info panel.
── Boundary Forecast ──
The Boundary Forecast projects the Trend Cloud and Super Channel bands a few bars into the future. Two modes are available: Regression fits a curve to recent band movement and can show potential turns ahead; Slope Extension simply continues the current direction in a straight line.
The lines fade the further out they go to reflect decreasing confidence. Useful for anticipating where the next structural level is likely to be, not for precise entries.
━━━ AUTO-OPTIMIZER ━━━
The Auto-Optimizer runs three parallel versions of the PRISM signal engine at different lookback lengths (short, mid, long — spaced by a configurable percentage around the base length). Each version tracks its own signal history and scores every signal based on how far price moved favorably within a set number of bars, in ATR tiers.
The optimizer continuously weights the three lengths by recent performance and blends them into a single effective lookback that is applied to the main signal engine.
━━━ INFO PANEL ━━━
The info panel is a live dashboard showing current conditions across four sections: Trend State, Momentum & Quality, Trend Regime, and PRISM Signals / Auto-Optimizer.
Position it anywhere on the chart using the Info Panel Location dropdown.
TREND ARCHITECT — QUICK START GUIDE
━━━ ADDING THE INDICATOR ━━━
- Open TradingView and navigate to your chart.
- Open the Indicators panel (top toolbar or / shortcut).
- Search for Trend Architect under your favorited scripts and add it to your chart.
━━━ HIDE YOUR DEFAULT CANDLES ━━━
Trend Architect draws its own custom candles, so you'll want to hide the chart's native candlesticks to avoid visual clutter.
On the chart:
- Right-click anywhere on the chart → Settings → go to the Symbol tab.
- Uncheck Body, Borders, and Wick (all three), then click OK.
Your chart background will now be clean and the indicator's candles will be the only ones visible.
━━━ SETTINGS MODE: SIMPLE vs. ADVANCED ━━━
The very first setting at the top of the indicator controls are unlocked.
- Simple — Unlocks only the main on/off toggles and visual components. Everything runs on tuned defaults. Start here.
- Advanced — Opens up every parameter: lookback windows, thresholds, filter toggles, etc. Use this once you're comfortable and want to fine-tune.
You can switch between modes at any time without losing your settings.
━━━ CHOOSING A THEME ━━━
Under Visual Components in the settings panel:
- Chart Background — Select whether you're using a dark or light chart background. This determines which theme palette is active.
- Dark Theme / Light Theme — Pick from 16 themes in each category. The theme colors everything: candles, cloud, channel bands, signals, and the info panel.
━━━ INFO PANEL ━━━
Toggle Enable Info Panel in Visual Components to show a live dashboard with:
- Trend state across multiple timeframes (immediate, short, medium, long term)
- Momentum, delta strength, volatility range
- Trend Regime Gate status (bull/bear regime active or not)
- PRISM Adaptive mode and effective parameter values
You can reposition it via the Info Panel Location dropdown.
━━━ TIPS FOR GETTING STARTED ━━━
- Start in Simple mode with all tools enabled. Get a feel for the visual layers before changing anything.
- If the chart feels busy, try toggling off the Trend Cloud body or the Boundary Forecast first.
- The Signal Offset setting (under Visual Components) controls how far B/S labels sit from the candles — adjust if they overlap.
- If you're on a fast timeframe (1m or below), PRISM Adaptive automatically extends lookback windows to compensate for noise. The info panel shows the effective values.
Phát hành các Ghi chú
9.1 Update- Performance improvement by throttling some calculations
- Added Heikin Ashi as candle coloring mode
- Adjusted other candle coloring modes
Mã nguồn mở
Theo đúng tinh thần TradingView, tác giả của tập lệnh này đã công bố nó dưới dạng mã nguồn mở, để các nhà giao dịch có thể xem xét và xác minh chức năng. Chúc mừng tác giả! Mặc dù bạn có thể sử dụng miễn phí, hãy nhớ rằng việc công bố lại mã phải tuân theo Nội quy.

discord.gg/REapC6SGtz
b3artrades@gmail.com
b3artrades@gmail.com
Thông báo miễn trừ trách nhiệm
Thông tin và các ấn phẩm này không nhằm mục đích, và không cấu thành, lời khuyên hoặc khuyến nghị về tài chính, đầu tư, giao dịch hay các loại khác do TradingView cung cấp hoặc xác nhận. Đọc thêm tại Điều khoản Sử dụng.
Mã nguồn mở
Theo đúng tinh thần TradingView, tác giả của tập lệnh này đã công bố nó dưới dạng mã nguồn mở, để các nhà giao dịch có thể xem xét và xác minh chức năng. Chúc mừng tác giả! Mặc dù bạn có thể sử dụng miễn phí, hãy nhớ rằng việc công bố lại mã phải tuân theo Nội quy.
discord.gg/REapC6SGtz
b3artrades@gmail.com
b3artrades@gmail.com
Thông báo miễn trừ trách nhiệm
Thông tin và các ấn phẩm này không nhằm mục đích, và không cấu thành, lời khuyên hoặc khuyến nghị về tài chính, đầu tư, giao dịch hay các loại khác do TradingView cung cấp hoặc xác nhận. Đọc thêm tại Điều khoản Sử dụng.