Cập nhật
ICT Confluence Signals
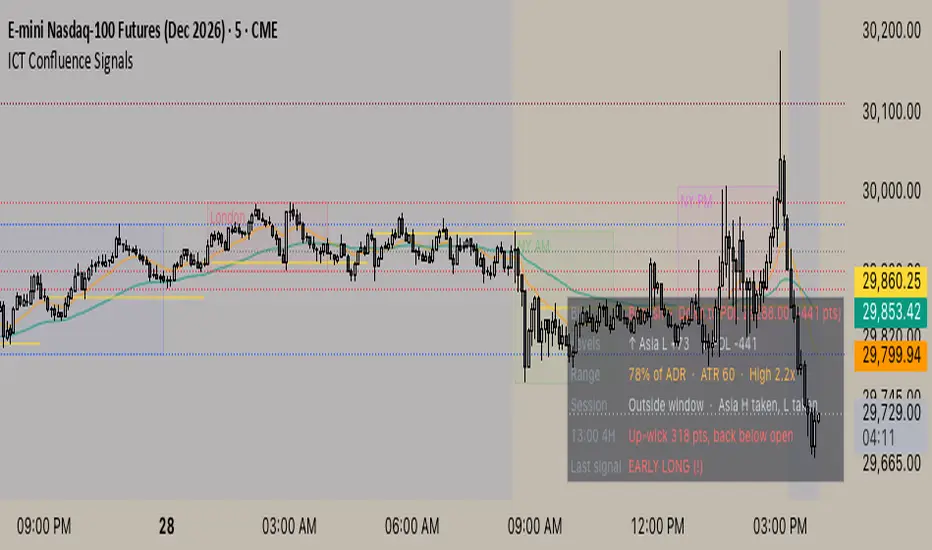
A minimal, session-based liquidity framework for index futures (Chicago time).
• Faint session boxes for Asia, London, NY AM and NY PM, plus dotted key levels: prior day and week high/low, NY open, and the Asia and London highs and lows.
• OTE zone: after a sweep of a key level (or from the day's range), draws the 62%, 70% and 79% retracement lines of the leg with their prices.
• Setups (computed in the background, used for alerts and the panel): A+ / B fair value gap entries in the zone, EARLY sweep reversals, and OTE rejections back out of the 62% line. Stops are placed beyond structure with an ATR floor; targets are in R and capped at the next key level.
• Filters (Block / Warn / Off): against the 4H/daily-open bias, too little room to the next level, untaken liquidity close to the stop.
• Compact context panel: bias and draw on liquidity, nearest levels, day range vs ADR and ATR, session, the current 4H candle, and the last signal. Optional rows show virtual-trade results by grade and a candle-delta split estimated from 1-minute intrabars.
This is for education only. It isn't financial advice.
• Faint session boxes for Asia, London, NY AM and NY PM, plus dotted key levels: prior day and week high/low, NY open, and the Asia and London highs and lows.
• OTE zone: after a sweep of a key level (or from the day's range), draws the 62%, 70% and 79% retracement lines of the leg with their prices.
• Setups (computed in the background, used for alerts and the panel): A+ / B fair value gap entries in the zone, EARLY sweep reversals, and OTE rejections back out of the 62% line. Stops are placed beyond structure with an ATR floor; targets are in R and capped at the next key level.
• Filters (Block / Warn / Off): against the 4H/daily-open bias, too little room to the next level, untaken liquidity close to the stop.
• Compact context panel: bias and draw on liquidity, nearest levels, day range vs ADR and ATR, session, the current 4H candle, and the last signal. Optional rows show virtual-trade results by grade and a candle-delta split estimated from 1-minute intrabars.
This is for education only. It isn't financial advice.
Phát hành các Ghi chú
Update: OTE 62/70/79 levels now stay on the chart outside the trading windows and carry over the 5 pm CT session change; they only redraw on a new sweep or a new extreme. One zone is shown at a time by default; enable "OTE: show long and short zones together" to see both.Phát hành các Ghi chú
Default setup is now sweep-reversal (EARLY) entries only, within 2 bars of the sweep. FVG entries and the OTE reaction signal are still available as options. Added a day-range vs ADR filter (default 100%) and split the results panel into two rows.Phát hành các Ghi chú
Removed the OTE reaction entry signal and its settings. The 62 / 70 / 79% levels remain on the chart as a visual reference.Phát hành các Ghi chú
Removed the 62 / 70 / 79% level lines and labels from the chart for a cleaner look. Sessions, key levels, sweeps and the context panel are unchanged.Phát hành các Ghi chú
Key level labels that sit close together (for example PDL and the Asia low) are now merged into one label, so they no longer overlap.Phát hành các Ghi chú
Updated description for the current version (no change to calculations).ICT Confluence Signals is a session-based liquidity tool for index futures (built and tested on NQ / MNQ, 5-minute chart). It maps where resting liquidity sits each day, watches for that liquidity to be swept, and summarizes the context in one compact panel so you can read the session at a glance. It is a context and alerting tool, not an automated trading system.
HOW IT WORKS
The idea behind the script: price often runs a well-known high or low (stops sit just beyond it), then reverses. The script tracks those levels, detects when one is swept, and checks whether the reversal happens fast and in line with the higher-timeframe bias.
1. Sessions and key levels
• Faint boxes for the Asia, London, NY AM and NY PM sessions (Chicago time, editable).
• Dotted key levels: previous day high/low, previous week high/low, NY open, and the Asia and London highs and lows.
• Levels that sit close together share one label (for example "PDL · Asia L") so the text never stacks.
2. Sweeps
A sweep is a wick through a key level followed by a close back inside it. The script detects sweeps of the levels above, plus "live" sweeps of the Asia and London high/low while those sessions are still forming.
3. EARLY setups (sweep reversals)
After a sweep, an EARLY setup triggers when price closes back beyond the sweep candle within a set number of bars (default 2) and before reaching the 14 EMA.
• The stop is placed beyond the sweep wick, with an ATR-based minimum.
• The target is a multiple of the risk (default 2R), capped at the next key level when that is closer.
• Optional fair value gap (FVG) entries can be switched on in the settings.
4. Filters (each can be set to Block, Warn or Off)
• Against the bias: the 4H trend (EMAs of the last closed 4H bar) and the daily open.
• Too little room: the next key level is closer than a minimum R.
• Untaken liquidity close to the stop side.
• Stops wider than a maximum ATR multiple are always blocked, and new entries are blocked once the day's range exceeds a set % of the average daily range.
5. Context panel (bottom right)
• Bias and draw on liquidity: the nearest untaken level in the direction of the bias, and its distance.
• Levels: the nearest key levels above and below.
• Range: the day's range as a % of ADR, ATR, and a volatility read.
• Session: whether you are inside the entry window, and which session highs/lows are taken or still open.
• 4H candle: whether the current 4H candle has wicked through its open.
• Last signal: the most recent setup, flagged if it was against the bias.
Optional rows show the results of the script's virtual trades by setup type and an orderflow split (estimated buy/sell delta from 1-minute bars). These are for studying the tool on your own chart, not a promise of future results.
ALERTS
Create an alert on the indicator and choose one of: Long setup, Short setup, EARLY setup, A+ setup, Clean setup (no warnings), or Any setup.
HOW TO USE IT
• Before the open: read the panel's bias and draw on liquidity and note which session highs/lows are still untaken.
• During the session: wait for a sweep of a key level, then look for an EARLY setup in the direction of the bias.
• Around high-impact news: the first move after a release often sweeps both sides. Waiting for the sweep and reclaim is usually cleaner than entering on the release.
• Size every trade to the stop distance and your own $ risk.
SETTINGS TIPS
• Session times are in Chicago time. Adjust them if you trade another market or another session.
• Risk per trade, stop method, target R and daily loss limits are in the Risk group.
• Turn on "Show blocked setups" to see the setups the filters removed.
• Keep the chart clean: signal markers are off by default; use the panel and alerts instead.
NOTES AND LIMITATIONS
• Designed for liquid index futures on intraday charts (5-minute recommended). Other markets and timeframes may need different session times and settings.
• Setups are confirmed on bar close. While a bar is still forming, a setup can appear and then disappear, so set alerts to "Once per bar close". The 4H bias uses the last closed 4H bar, so it does not change mid-candle.
• The orderflow reading is an approximation from 1-minute candles, not true bid/ask data, and needs intrabar data that may not be available far back in history.
• Past behaviour of any setup does not guarantee future results. Use it alongside your own analysis and risk management.

Thông báo miễn trừ trách nhiệm
Thông tin và các ấn phẩm này không nhằm mục đích, và không cấu thành, lời khuyên hoặc khuyến nghị về tài chính, đầu tư, giao dịch hay các loại khác do TradingView cung cấp hoặc xác nhận. Đọc thêm tại Điều khoản Sử dụng.
Thông báo miễn trừ trách nhiệm
Thông tin và các ấn phẩm này không nhằm mục đích, và không cấu thành, lời khuyên hoặc khuyến nghị về tài chính, đầu tư, giao dịch hay các loại khác do TradingView cung cấp hoặc xác nhận. Đọc thêm tại Điều khoản Sử dụng.