First Hour High Low + 10:15 Mark_Kali
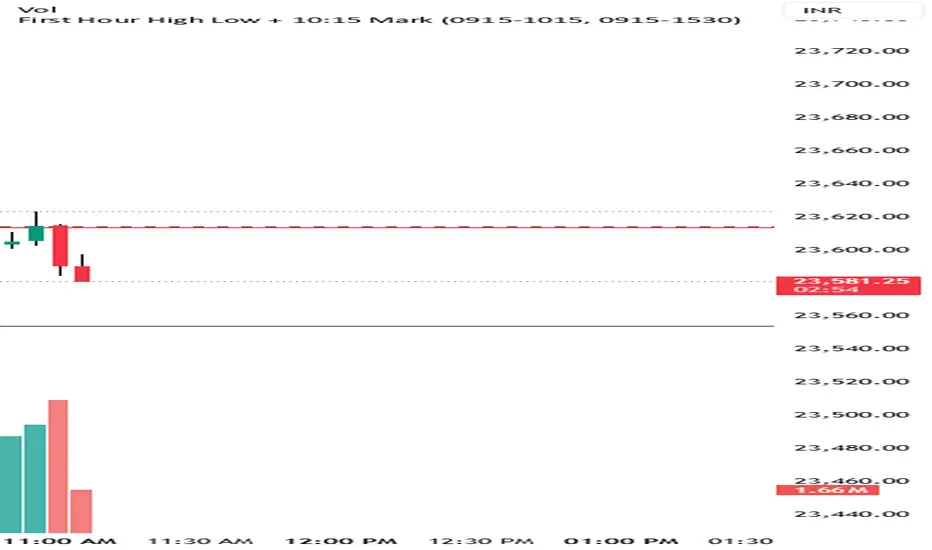
First Hour High Low Indicator
This indicator automatically marks the First Hour High and First Hour Low of the trading session and extends those levels only within the same trading day. It is specially designed for intraday traders who focus on support-resistance reactions, failed breakouts, and failed breakdown setups.
The indicator also places a visual marker at 10:15 AM, showing the completion of the first trading hour.
Key Features
Automatically detects the first hour range (9:15 AM – 10:15 AM)
Draws:
First Hour High
First Hour Low
Lines remain restricted to the same trading day
Historical levels visible for manual backtesting
10:15 AM session completion marker
Clean chart visualization without clutter
How I Use It
The first hour range often acts as an important intraday support and resistance zone.
I mainly use this indicator to identify:
Failed breakouts above First Hour High
Failed breakdowns below First Hour Low
Rejections from these levels
Support and resistance retests
Reversal opportunities after liquidity grabs
In many cases:
Price breaks the First Hour High/Low,
Traders enter breakout trades,
But price quickly reverses back inside the range.
These failed moves can provide high probability trading opportunities with relatively small stop losses.
Best Use Cases
Index trading
Options trading
Intraday momentum trading
Reversal trading
ORB (Opening Range Breakout) analysis
Manual chart study and backtesting
Recommended Timeframes
Works best on:
1 Minute
3 Minute
5 Minute
15 Minute charts
Important Note
This indicator is a price action tool and should be used together with:
Volume
Market trend
Price structure
Risk management
No indicator guarantees profits. Always manage risk properly.
This indicator automatically marks the First Hour High and First Hour Low of the trading session and extends those levels only within the same trading day. It is specially designed for intraday traders who focus on support-resistance reactions, failed breakouts, and failed breakdown setups.
The indicator also places a visual marker at 10:15 AM, showing the completion of the first trading hour.
Key Features
Automatically detects the first hour range (9:15 AM – 10:15 AM)
Draws:
First Hour High
First Hour Low
Lines remain restricted to the same trading day
Historical levels visible for manual backtesting
10:15 AM session completion marker
Clean chart visualization without clutter
How I Use It
The first hour range often acts as an important intraday support and resistance zone.
I mainly use this indicator to identify:
Failed breakouts above First Hour High
Failed breakdowns below First Hour Low
Rejections from these levels
Support and resistance retests
Reversal opportunities after liquidity grabs
In many cases:
Price breaks the First Hour High/Low,
Traders enter breakout trades,
But price quickly reverses back inside the range.
These failed moves can provide high probability trading opportunities with relatively small stop losses.
Best Use Cases
Index trading
Options trading
Intraday momentum trading
Reversal trading
ORB (Opening Range Breakout) analysis
Manual chart study and backtesting
Recommended Timeframes
Works best on:
1 Minute
3 Minute
5 Minute
15 Minute charts
Important Note
This indicator is a price action tool and should be used together with:
Volume
Market trend
Price structure
Risk management
No indicator guarantees profits. Always manage risk properly.

Thông báo miễn trừ trách nhiệm
Thông tin và các ấn phẩm này không nhằm mục đích, và không cấu thành, lời khuyên hoặc khuyến nghị về tài chính, đầu tư, giao dịch hay các loại khác do TradingView cung cấp hoặc xác nhận. Đọc thêm tại Điều khoản Sử dụng.
Thông báo miễn trừ trách nhiệm
Thông tin và các ấn phẩm này không nhằm mục đích, và không cấu thành, lời khuyên hoặc khuyến nghị về tài chính, đầu tư, giao dịch hay các loại khác do TradingView cung cấp hoặc xác nhận. Đọc thêm tại Điều khoản Sử dụng.