OPEN-SOURCE SCRIPT
[blackcat] L0 Institutional Strength Momentum
█ OVERVIEW
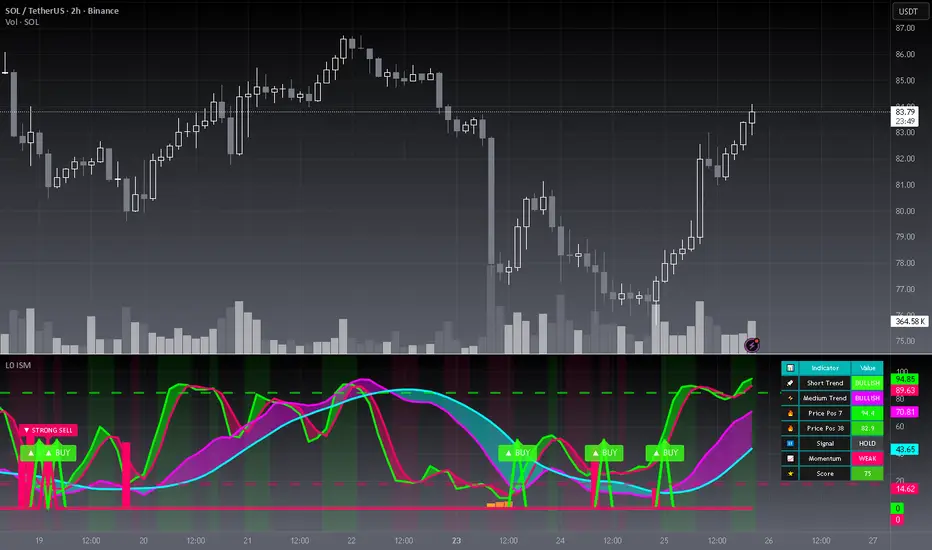
The Institutional Strength Momentum (ISM) indicator is a comprehensive technical analysis tool that combines price position analysis, multi-timeframe trend bands, and momentum-based signal detection to identify potential institutional buying and selling opportunities in the market.
█ CONCEPTS
This indicator utilizes a dual-timeframe price position methodology combined with volatility-adjusted momentum analysis to identify market conditions where institutional activity may be present.
Key Principles
• Price Position Analysis: Measures where current price sits within short and long-term ranges
• Trend Band Convergence: Uses SMA-based bands to visualize trend direction and strength
• Momentum Conditioning: Applies volatility-adjusted filters to qualify signal validity
• Multi-Signal Classification: Categorizes signals by strength (Strong/Medium/Weak)
█ HOW TO USE
1 — Add the indicator to your chart from the Indicators menu
2 — Observe the trend bands: Green/Red for short-term, Purple/Blue for medium-term
3 — Monitor the status table in the top-right corner for real-time metrics
4 — Look for Buy/Sell signal labels that appear when conditions are met
Input Parameters
• Short Period (Default: 7) — Period for short-term price position calculation
• Long Period (Default: 38) — Period for medium-term price position calculation
• Short SMA Length (Default: 3) — Smoothing period for short-term momentum
• Medium SMA Length 1 (Default: 5) — First smoothing period for medium-term bull
• Medium SMA Length 2 (Default: 10) — Second smoothing period for medium-term bear
• Bull Risk Level (Default: 85) — Upper threshold for overbought conditions
• Bear Risk Level (Default: 18) — Lower threshold for oversold conditions
• Show Trend Bands (Default: true) — Toggle visibility of trend bands
• Show Buy/Sell Signals (Default: true) — Toggle visibility of signal labels
• Show Status Table (Default: true) — Toggle visibility of the status panel
█ SIGNALS
Visual Elements
• Short-term Bull/Bear Bands: Green indicates bullish pressure, Red indicates bearish pressure
• Medium-term Bull/Bear Bands: Purple indicates bullish momentum, Blue indicates bearish momentum
• Histogram Bars: Yellow-to-Red gradient showing increasing deviation signals
• Buy Signal Labels: "▲ STRONG BUY", "▲ BUY", "▲ WEAK BUY" based on momentum strength
• Sell Signal Labels: "▼ STRONG SELL", "▼ SELL", "▼ WEAK SELL" based on momentum strength
• Background Color: Subtle green when overall bullish, red when overall bearish
Status Table Metrics
• Short Trend: Current short-term trend direction (BULLISH/BEARISH)
• Medium Trend: Current medium-term trend direction (BULLISH/BEARISH)
• Price Pos 7: 7-period price position percentage (0-100)
• Price Pos 38: 38-period price position percentage (0-100)
• Signal: Current signal state (BUY/SELL/WATCH/HOLD)
• Momentum: Momentum strength level (STRONG/MODERATE/WEAK/NONE)
• Score: Overall bullish score combining all metrics (0-100)
█ ALERT CONDITIONS
The indicator includes six built-in alert conditions:
• Low Buy Signal: Triggered when a buy signal is detected
• Low Sell Signal: Triggered when a sell signal is detected
• Buy Signal Cross: Triggered on bullish crossover with valid momentum
• Sell Signal Cross: Triggered on bearish crossunder with valid momentum
• Bullish Trend: Triggered when both short and medium trends turn bullish
• Bearish Trend: Triggered when both short and medium trends turn bearish
█ LIMITATIONS
• Best suited for trending markets; may produce false signals in ranging conditions
• Signal quality depends on proper parameter tuning for specific instruments
• Past signals do not guarantee future performance
• Should be used in conjunction with other technical analysis tools
• Not recommended as a standalone trading system
█ NOTES
• The indicator uses a neon color palette for enhanced visual clarity
• Signal strength classification is based on momentum threshold levels
• The overall score provides a quick assessment of market conditions
• Compatible with all timeframes but optimized for intraday to swing trading
═════════════════════════════════════════════════════════════════════════
For questions or feedback, use comments section below.
The Institutional Strength Momentum (ISM) indicator is a comprehensive technical analysis tool that combines price position analysis, multi-timeframe trend bands, and momentum-based signal detection to identify potential institutional buying and selling opportunities in the market.
█ CONCEPTS
This indicator utilizes a dual-timeframe price position methodology combined with volatility-adjusted momentum analysis to identify market conditions where institutional activity may be present.
Key Principles
• Price Position Analysis: Measures where current price sits within short and long-term ranges
• Trend Band Convergence: Uses SMA-based bands to visualize trend direction and strength
• Momentum Conditioning: Applies volatility-adjusted filters to qualify signal validity
• Multi-Signal Classification: Categorizes signals by strength (Strong/Medium/Weak)
█ HOW TO USE
1 — Add the indicator to your chart from the Indicators menu
2 — Observe the trend bands: Green/Red for short-term, Purple/Blue for medium-term
3 — Monitor the status table in the top-right corner for real-time metrics
4 — Look for Buy/Sell signal labels that appear when conditions are met
Input Parameters
• Short Period (Default: 7) — Period for short-term price position calculation
• Long Period (Default: 38) — Period for medium-term price position calculation
• Short SMA Length (Default: 3) — Smoothing period for short-term momentum
• Medium SMA Length 1 (Default: 5) — First smoothing period for medium-term bull
• Medium SMA Length 2 (Default: 10) — Second smoothing period for medium-term bear
• Bull Risk Level (Default: 85) — Upper threshold for overbought conditions
• Bear Risk Level (Default: 18) — Lower threshold for oversold conditions
• Show Trend Bands (Default: true) — Toggle visibility of trend bands
• Show Buy/Sell Signals (Default: true) — Toggle visibility of signal labels
• Show Status Table (Default: true) — Toggle visibility of the status panel
█ SIGNALS
Visual Elements
• Short-term Bull/Bear Bands: Green indicates bullish pressure, Red indicates bearish pressure
• Medium-term Bull/Bear Bands: Purple indicates bullish momentum, Blue indicates bearish momentum
• Histogram Bars: Yellow-to-Red gradient showing increasing deviation signals
• Buy Signal Labels: "▲ STRONG BUY", "▲ BUY", "▲ WEAK BUY" based on momentum strength
• Sell Signal Labels: "▼ STRONG SELL", "▼ SELL", "▼ WEAK SELL" based on momentum strength
• Background Color: Subtle green when overall bullish, red when overall bearish
Status Table Metrics
• Short Trend: Current short-term trend direction (BULLISH/BEARISH)
• Medium Trend: Current medium-term trend direction (BULLISH/BEARISH)
• Price Pos 7: 7-period price position percentage (0-100)
• Price Pos 38: 38-period price position percentage (0-100)
• Signal: Current signal state (BUY/SELL/WATCH/HOLD)
• Momentum: Momentum strength level (STRONG/MODERATE/WEAK/NONE)
• Score: Overall bullish score combining all metrics (0-100)
█ ALERT CONDITIONS
The indicator includes six built-in alert conditions:
• Low Buy Signal: Triggered when a buy signal is detected
• Low Sell Signal: Triggered when a sell signal is detected
• Buy Signal Cross: Triggered on bullish crossover with valid momentum
• Sell Signal Cross: Triggered on bearish crossunder with valid momentum
• Bullish Trend: Triggered when both short and medium trends turn bullish
• Bearish Trend: Triggered when both short and medium trends turn bearish
█ LIMITATIONS
• Best suited for trending markets; may produce false signals in ranging conditions
• Signal quality depends on proper parameter tuning for specific instruments
• Past signals do not guarantee future performance
• Should be used in conjunction with other technical analysis tools
• Not recommended as a standalone trading system
█ NOTES
• The indicator uses a neon color palette for enhanced visual clarity
• Signal strength classification is based on momentum threshold levels
• The overall score provides a quick assessment of market conditions
• Compatible with all timeframes but optimized for intraday to swing trading
═════════════════════════════════════════════════════════════════════════
For questions or feedback, use comments section below.
Mã nguồn mở
Theo đúng tinh thần TradingView, tác giả của tập lệnh này đã công bố nó dưới dạng mã nguồn mở, để các nhà giao dịch có thể xem xét và xác minh chức năng. Chúc mừng tác giả! Mặc dù bạn có thể sử dụng miễn phí, hãy nhớ rằng việc công bố lại mã phải tuân theo Nội quy.

Avoid losing contact!Don't miss out! The first and most important thing to do is to join my Discord chat now! Click here to start your adventure: discord.com/invite/ZTGpQJq 防止失联,请立即行动,加入本猫聊天群: discord.com/invite/ZTGpQJq
Thông báo miễn trừ trách nhiệm
Thông tin và các ấn phẩm này không nhằm mục đích, và không cấu thành, lời khuyên hoặc khuyến nghị về tài chính, đầu tư, giao dịch hay các loại khác do TradingView cung cấp hoặc xác nhận. Đọc thêm tại Điều khoản Sử dụng.
Mã nguồn mở
Theo đúng tinh thần TradingView, tác giả của tập lệnh này đã công bố nó dưới dạng mã nguồn mở, để các nhà giao dịch có thể xem xét và xác minh chức năng. Chúc mừng tác giả! Mặc dù bạn có thể sử dụng miễn phí, hãy nhớ rằng việc công bố lại mã phải tuân theo Nội quy.
Avoid losing contact!Don't miss out! The first and most important thing to do is to join my Discord chat now! Click here to start your adventure: discord.com/invite/ZTGpQJq 防止失联,请立即行动,加入本猫聊天群: discord.com/invite/ZTGpQJq
Thông báo miễn trừ trách nhiệm
Thông tin và các ấn phẩm này không nhằm mục đích, và không cấu thành, lời khuyên hoặc khuyến nghị về tài chính, đầu tư, giao dịch hay các loại khác do TradingView cung cấp hoặc xác nhận. Đọc thêm tại Điều khoản Sử dụng.