Opening Range Comparison [AFD]
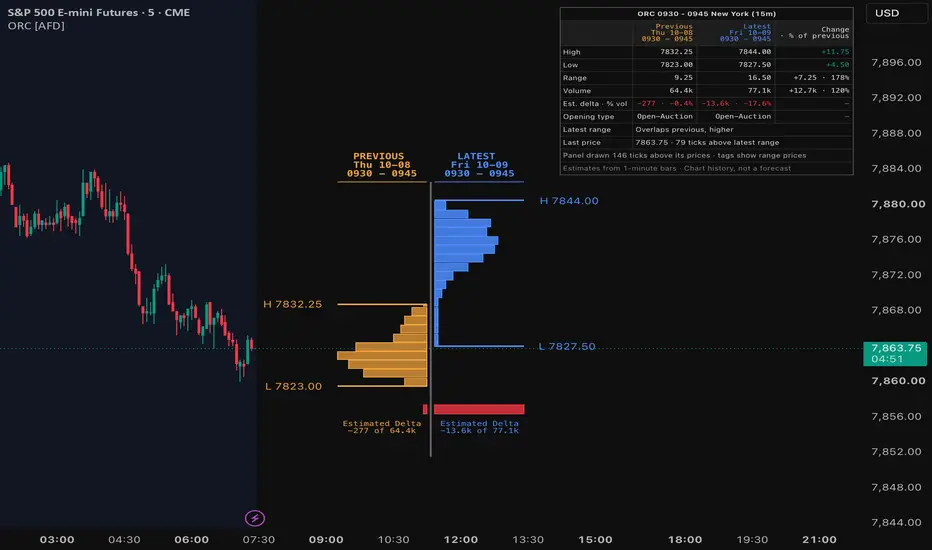
Compare the latest opening range with the previous session's.
Opening Range Comparison puts both ranges on one price scale, right of the last bar. Highs, lows, volume by price and estimated delta share one panel, plus a table with the numbers. Before the next open, LATEST still means the prior session.
What you see
How it works
Setup
Good to know
Describes chart history only: no signals, no forecasts. Educational use; not financial advice.
Opening Range Comparison puts both ranges on one price scale, right of the last bar. Highs, lows, volume by price and estimated delta share one panel, plus a table with the numbers. Before the next open, LATEST still means the prior session.
What you see
- Two profiles side by side, PREVIOUS and LATEST, each with its date and its opening-range window (e.g. 0930 - 0945)
- Each range's high and low as solid lines with price tags. By default the panel is raised one panel height to clear the table; the tags always show the real prices
- Volume by price for each range, and an Estimated Delta bar with its figure, e.g. "−13.6k of 77.1k"
- A table: high, low, range, volume, estimated delta, opening type, where the latest range sits against the previous one, and last price with its distance when outside the latest range
- Prices in the chart's own format, including 32nds and eighths on bond and grain futures
How it works
- Each session's opening range is read from its 1-minute bars on supported standard 1 to 60 minute charts
- Both ranges share one tick grid; each 1-minute bar's volume is spread uniformly across its price range, with each row receiving the share its tick overlap covers. A flat minute puts its volume in its close's row
- Estimated delta adds the volume of 1-minute bars that close above their open and subtracts those that close below; an unchanged bar counts zero
- Previous means the preceding recorded session, not simply the previous calendar day. When required session or opening-range minute data is unavailable, a note replaces the comparison; gaps within an available range are measured from the bars present
Setup
- Standard 1 to 60 minute charts. Opening range 5, 15 (default), 30 or 60 minutes
- Auto anchors futures at 09:30 New York and other symbols at their regular-session open. Custom sets the session and time zone; it is needed when Auto has no regular-session anchor
- Layout: Butterfly (default) or Twin candles
- Distance in ticks (default), price, currency or pips. Pips applies to forex; elsewhere it reads in ticks. Currency also reads in ticks when no tick value is available
- Panel background is off by default. Volume rows have opaque outlines in their profile color
- Panel placement, height offset and gap; table size and corner. Auto text scales headers and captions with zoom; price tags remain normal size
Good to know
- The latest range develops from closed 1-minute bars while its window is open: the table notes "Forming 7/15" and the previous range's measurements and profile use the same elapsed minutes. The previous opening-type label still uses its full completed range. The newest minute counts once the next minute starts; last price follows the live price
- Estimated delta and volume by price are estimates from 1-minute bars (candle direction and an even spread over each bar's range), not order flow
- Volume by price shows from a 15-minute range up
- Opening type is a rule-based label from the range's 1-minute bars and its own prior completed daily high, low and ATR(14). The latest label is undecided while its range is forming
- Extreme vertical compression can merge volume rows, and narrow Twin ranges can overlap price-tag text. Large tables and panel offsets can also overlap the panel
- Seconds, charts above 60 minutes and non-standard charts are not supported and show a note instead
Describes chart history only: no signals, no forecasts. Educational use; not financial advice.

Auction Foundry — see the auction more clearly. Educational tools; not investment advice.
Discord support: discord.gg/df6XEnyGC6
Website: auction-foundry.io
Instagram: instagram.com/AuctionFoundry
X: @AuctionFoundry
Discord support: discord.gg/df6XEnyGC6
Website: auction-foundry.io
Instagram: instagram.com/AuctionFoundry
X: @AuctionFoundry
Thông báo miễn trừ trách nhiệm
Thông tin và các ấn phẩm này không nhằm mục đích, và không cấu thành, lời khuyên hoặc khuyến nghị về tài chính, đầu tư, giao dịch hay các loại khác do TradingView cung cấp hoặc xác nhận. Đọc thêm tại Điều khoản Sử dụng.
Auction Foundry — see the auction more clearly. Educational tools; not investment advice.
Discord support: discord.gg/df6XEnyGC6
Website: auction-foundry.io
Instagram: instagram.com/AuctionFoundry
X: @AuctionFoundry
Discord support: discord.gg/df6XEnyGC6
Website: auction-foundry.io
Instagram: instagram.com/AuctionFoundry
X: @AuctionFoundry
Thông báo miễn trừ trách nhiệm
Thông tin và các ấn phẩm này không nhằm mục đích, và không cấu thành, lời khuyên hoặc khuyến nghị về tài chính, đầu tư, giao dịch hay các loại khác do TradingView cung cấp hoặc xác nhận. Đọc thêm tại Điều khoản Sử dụng.