OPEN-SOURCE SCRIPT
RCA Relative Volume (RVol)
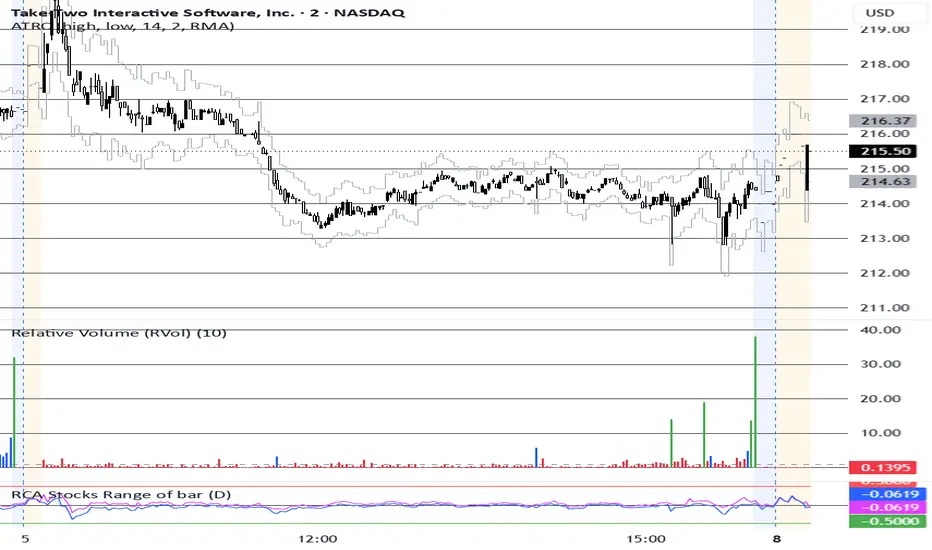
In the financial and trading markets, RVOL stands for Relative Volume. It is a technical indicator that compares the current trading volume of a stock (or other asset) to its average historical volume over a specified period (such as 10, 20, or 30 days). In this case, the average is calculated over the data of the same time of day (ex. 9:45 am current volume vs 10-day 9:45 am average volume).
The Formula= Current Volume/Volume.
RVOL of 1.0: The asset is trading at its exact average volume for that time of day.
RVOL above 2.0: The asset is "in play" and trading at twice its normal volume. This usually signals heightened market interest, increased liquidity, and the potential for large, volatile price movements.
RVOL below 1.0: The asset is experiencing lower-than-average market participation, typically resulting in a quieter, less volatile trading session.
The Formula= Current Volume/Volume.
RVOL of 1.0: The asset is trading at its exact average volume for that time of day.
RVOL above 2.0: The asset is "in play" and trading at twice its normal volume. This usually signals heightened market interest, increased liquidity, and the potential for large, volatile price movements.
RVOL below 1.0: The asset is experiencing lower-than-average market participation, typically resulting in a quieter, less volatile trading session.
Mã nguồn mở
Theo đúng tinh thần TradingView, tác giả của tập lệnh này đã công bố nó dưới dạng mã nguồn mở, để các nhà giao dịch có thể xem xét và xác minh chức năng. Chúc mừng tác giả! Mặc dù bạn có thể sử dụng miễn phí, hãy nhớ rằng việc công bố lại mã phải tuân theo Nội quy.

Thông báo miễn trừ trách nhiệm
Thông tin và các ấn phẩm này không nhằm mục đích, và không cấu thành, lời khuyên hoặc khuyến nghị về tài chính, đầu tư, giao dịch hay các loại khác do TradingView cung cấp hoặc xác nhận. Đọc thêm tại Điều khoản Sử dụng.
Mã nguồn mở
Theo đúng tinh thần TradingView, tác giả của tập lệnh này đã công bố nó dưới dạng mã nguồn mở, để các nhà giao dịch có thể xem xét và xác minh chức năng. Chúc mừng tác giả! Mặc dù bạn có thể sử dụng miễn phí, hãy nhớ rằng việc công bố lại mã phải tuân theo Nội quy.
Thông báo miễn trừ trách nhiệm
Thông tin và các ấn phẩm này không nhằm mục đích, và không cấu thành, lời khuyên hoặc khuyến nghị về tài chính, đầu tư, giao dịch hay các loại khác do TradingView cung cấp hoặc xác nhận. Đọc thêm tại Điều khoản Sử dụng.